The Globe
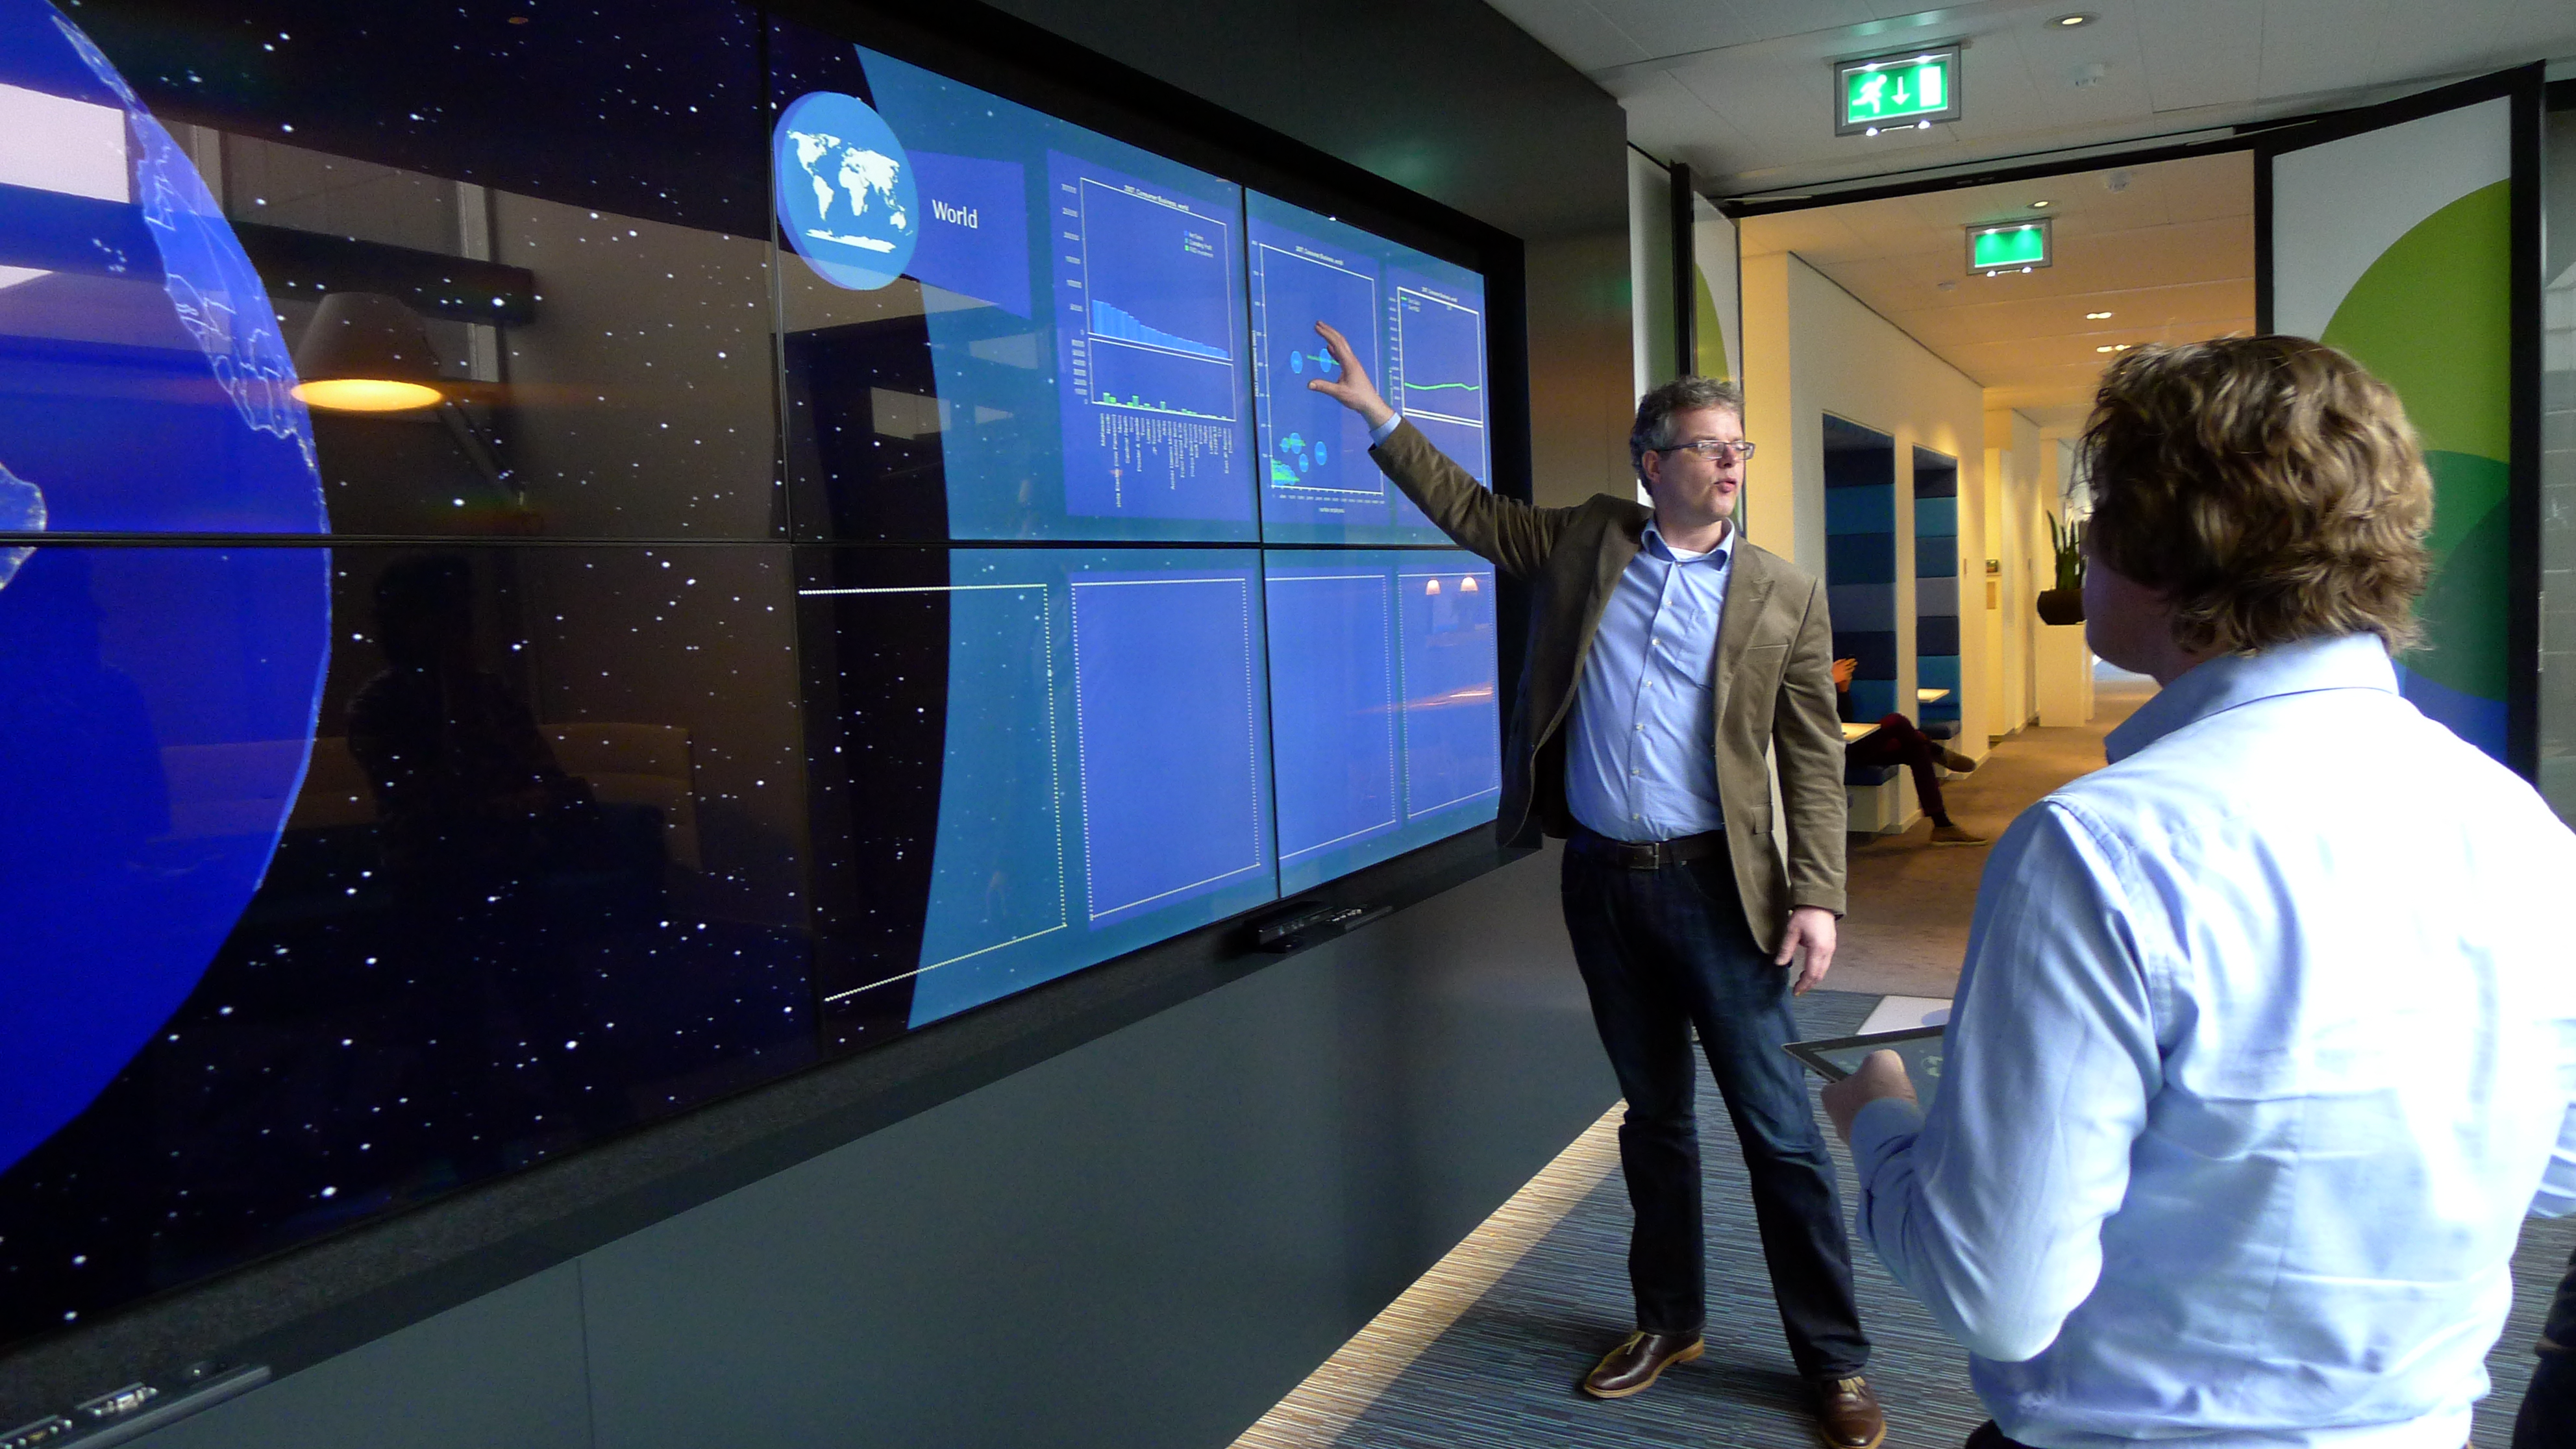
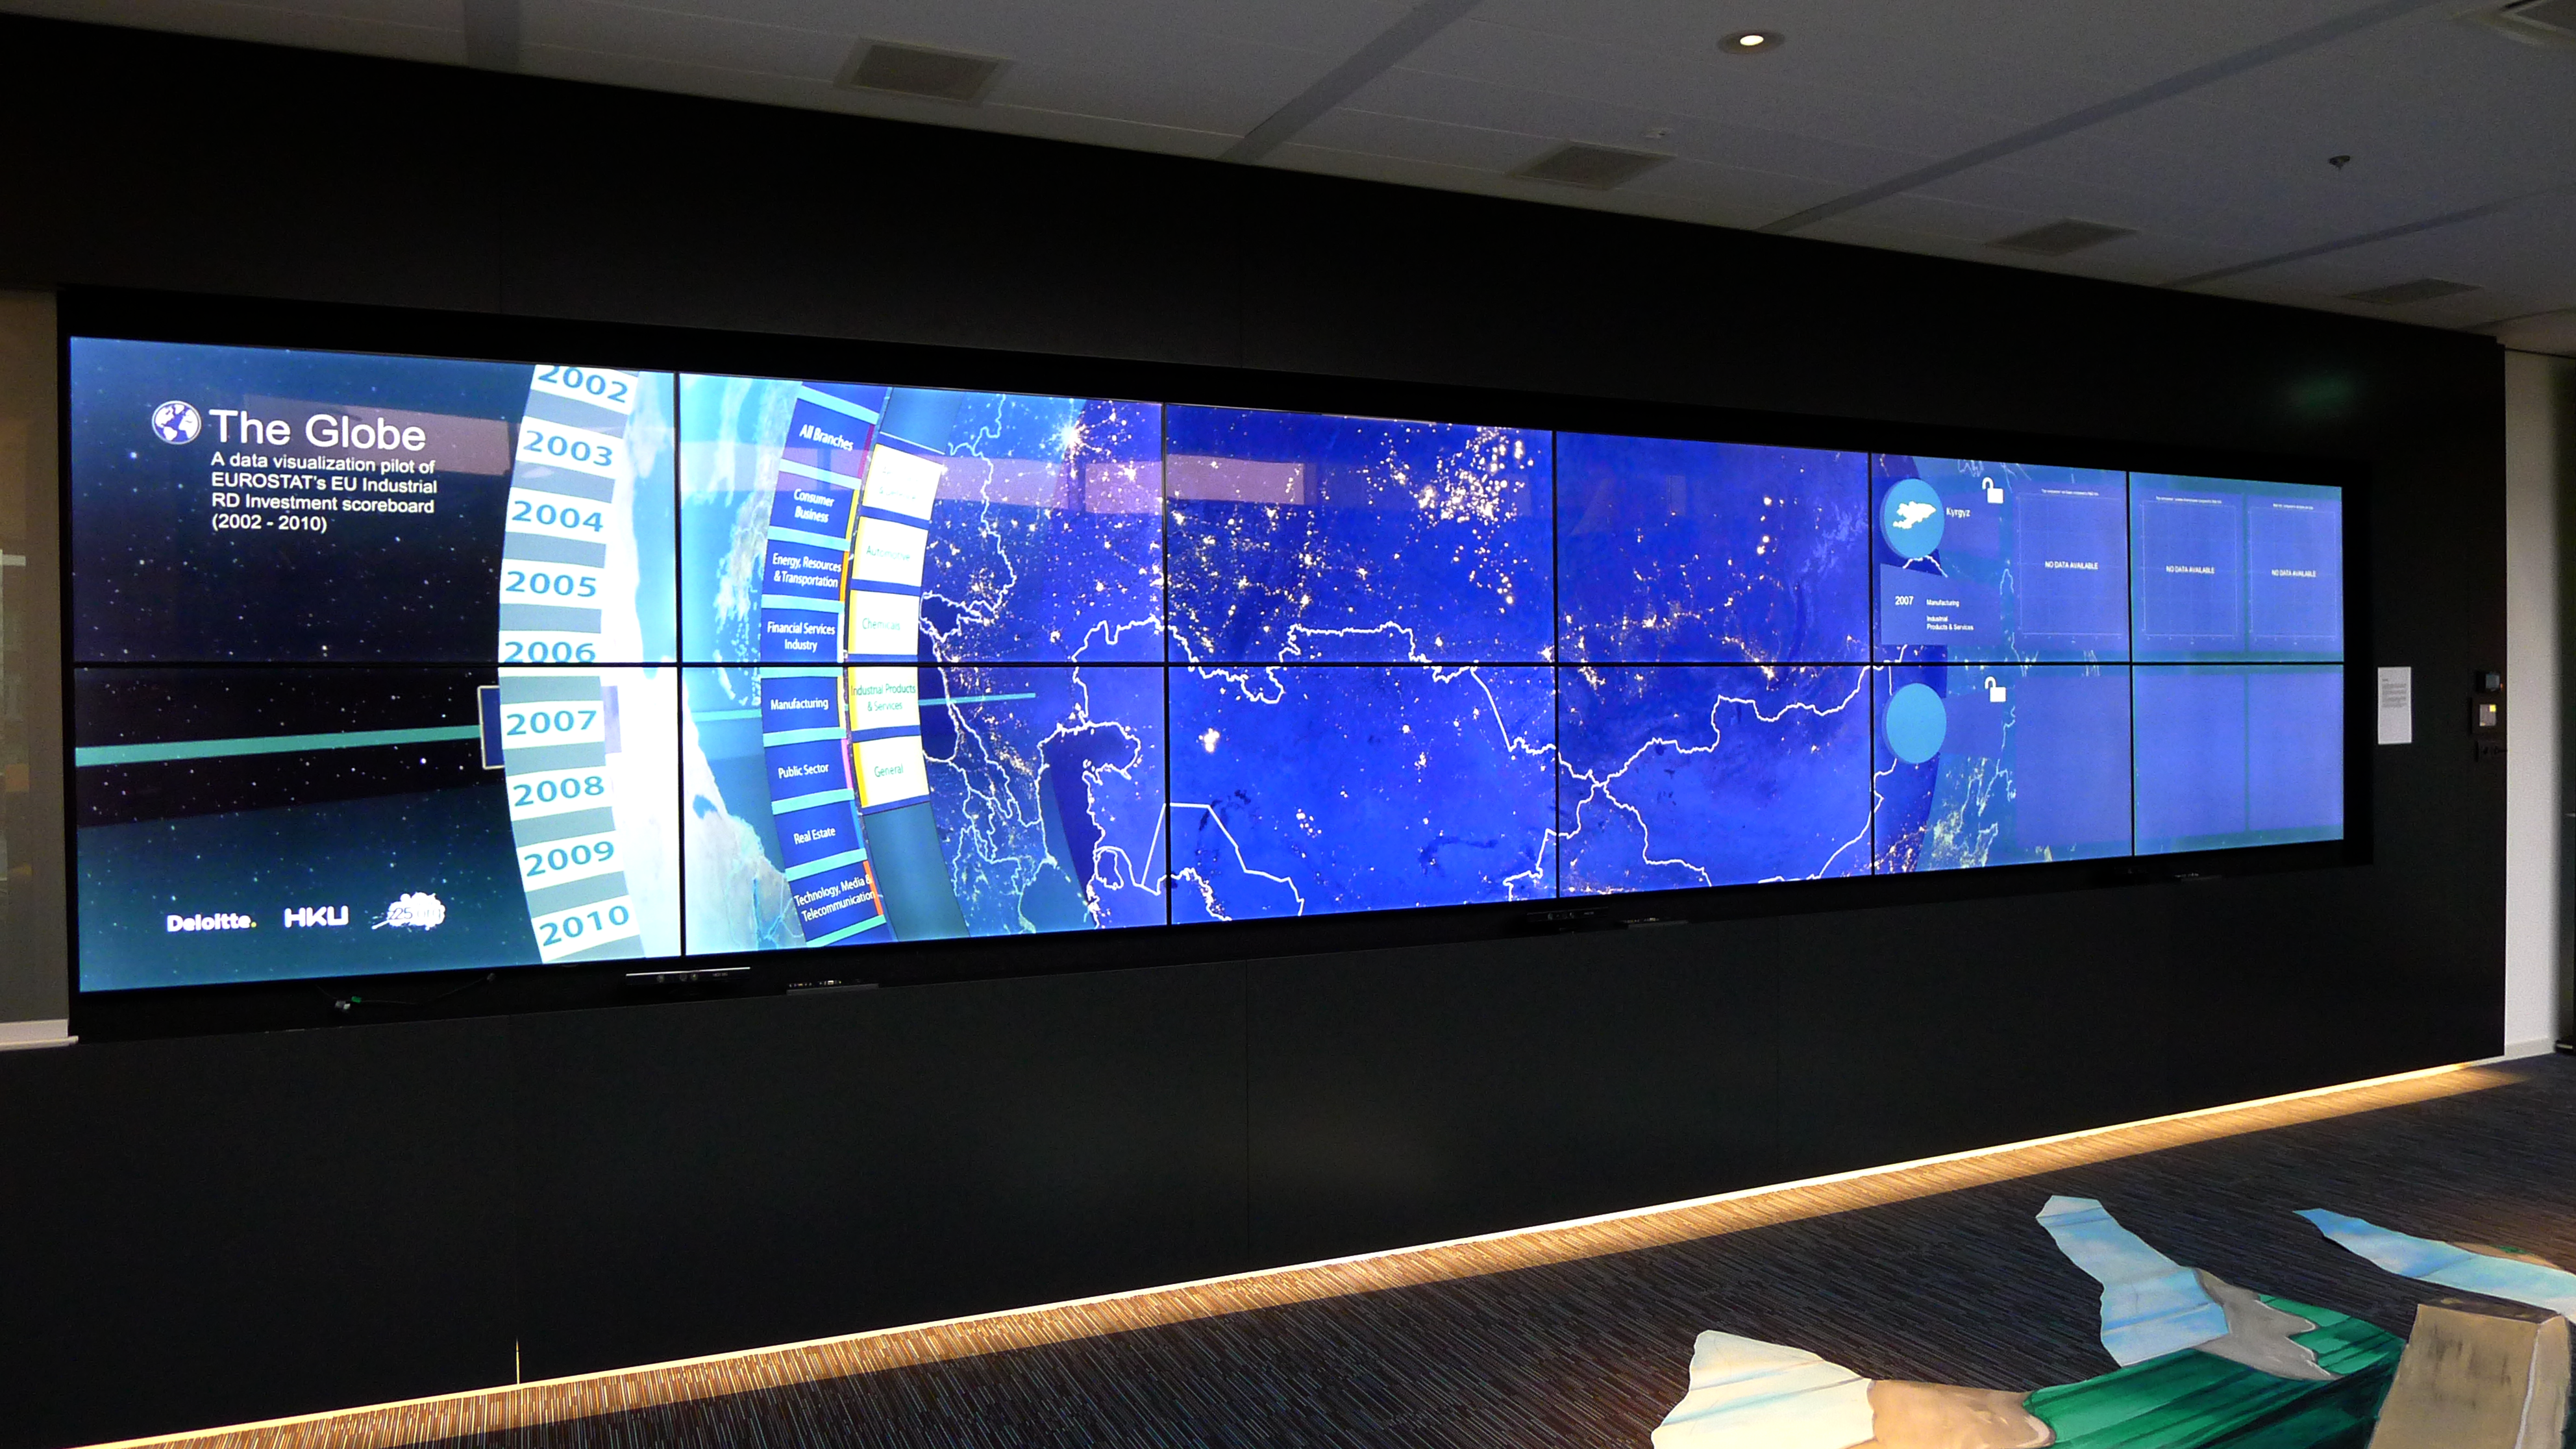
I worked on this project in conjunction with Stichting z25.org, the Media And Performance Lab (MAPLAB) to create a data visualisation pilot for the iZone, an environment at the Utrecht office of Deloitte which stimulates to think and act differently through it’s innovative design.
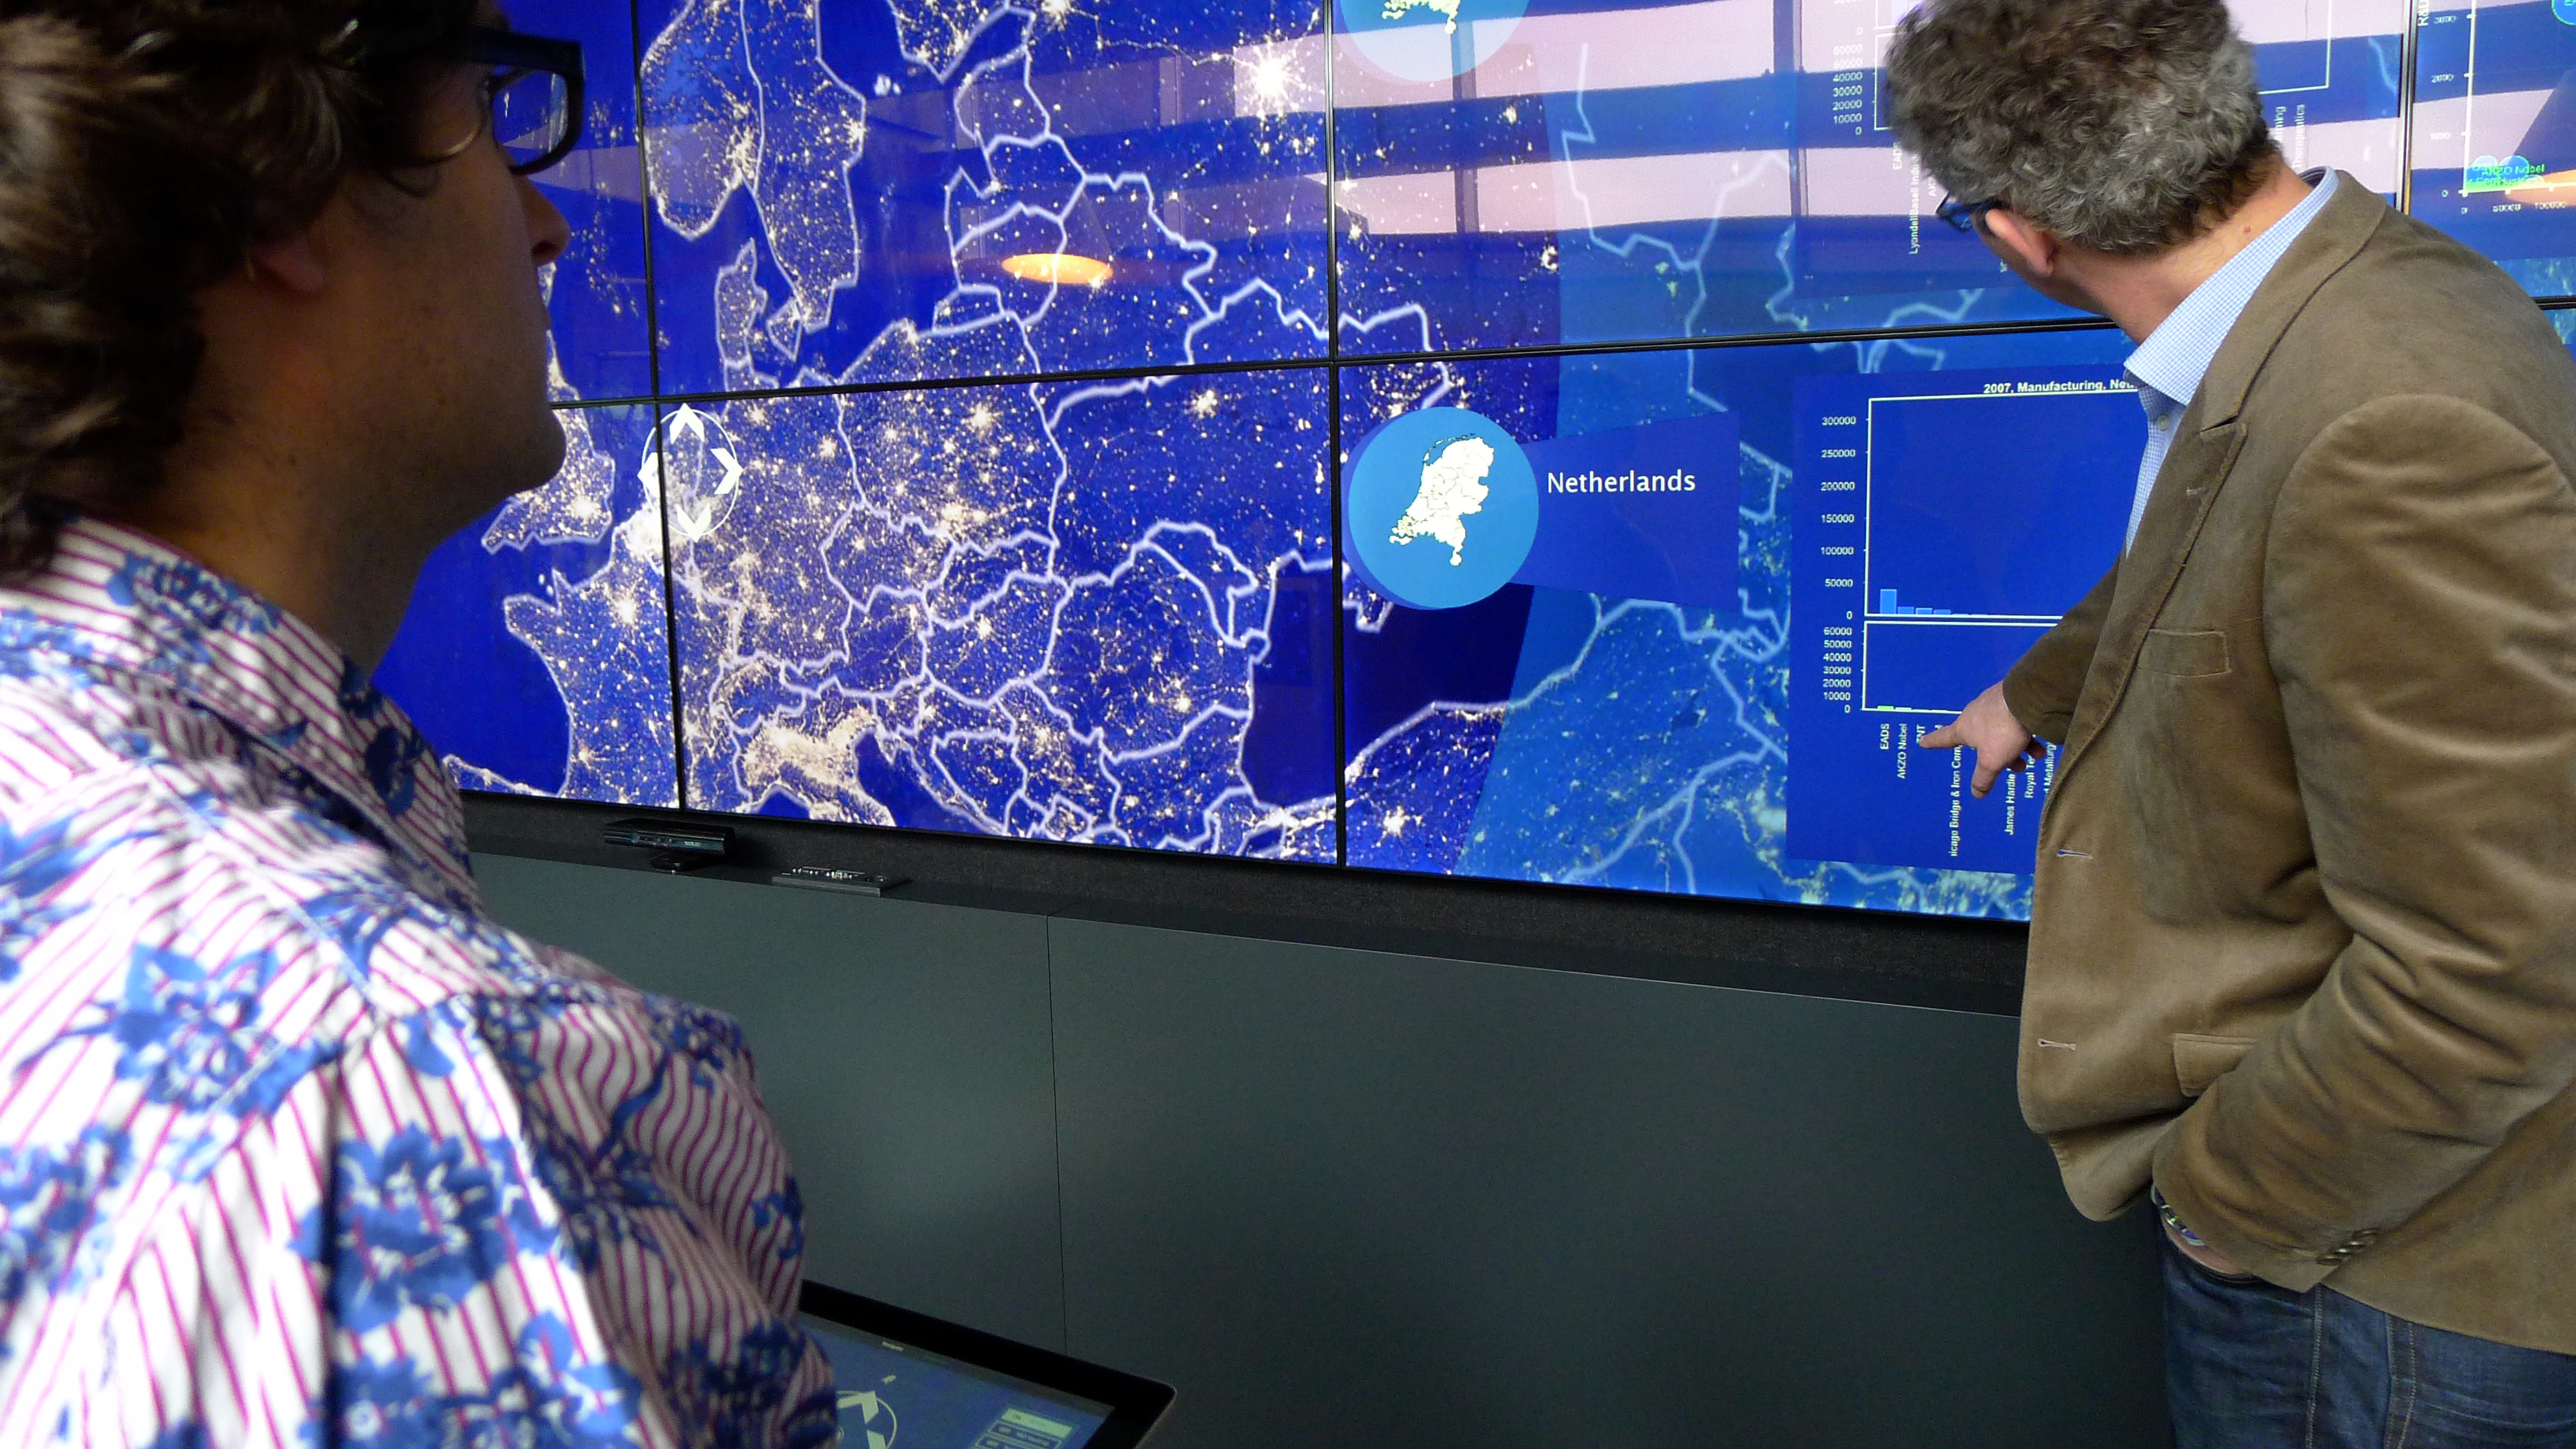
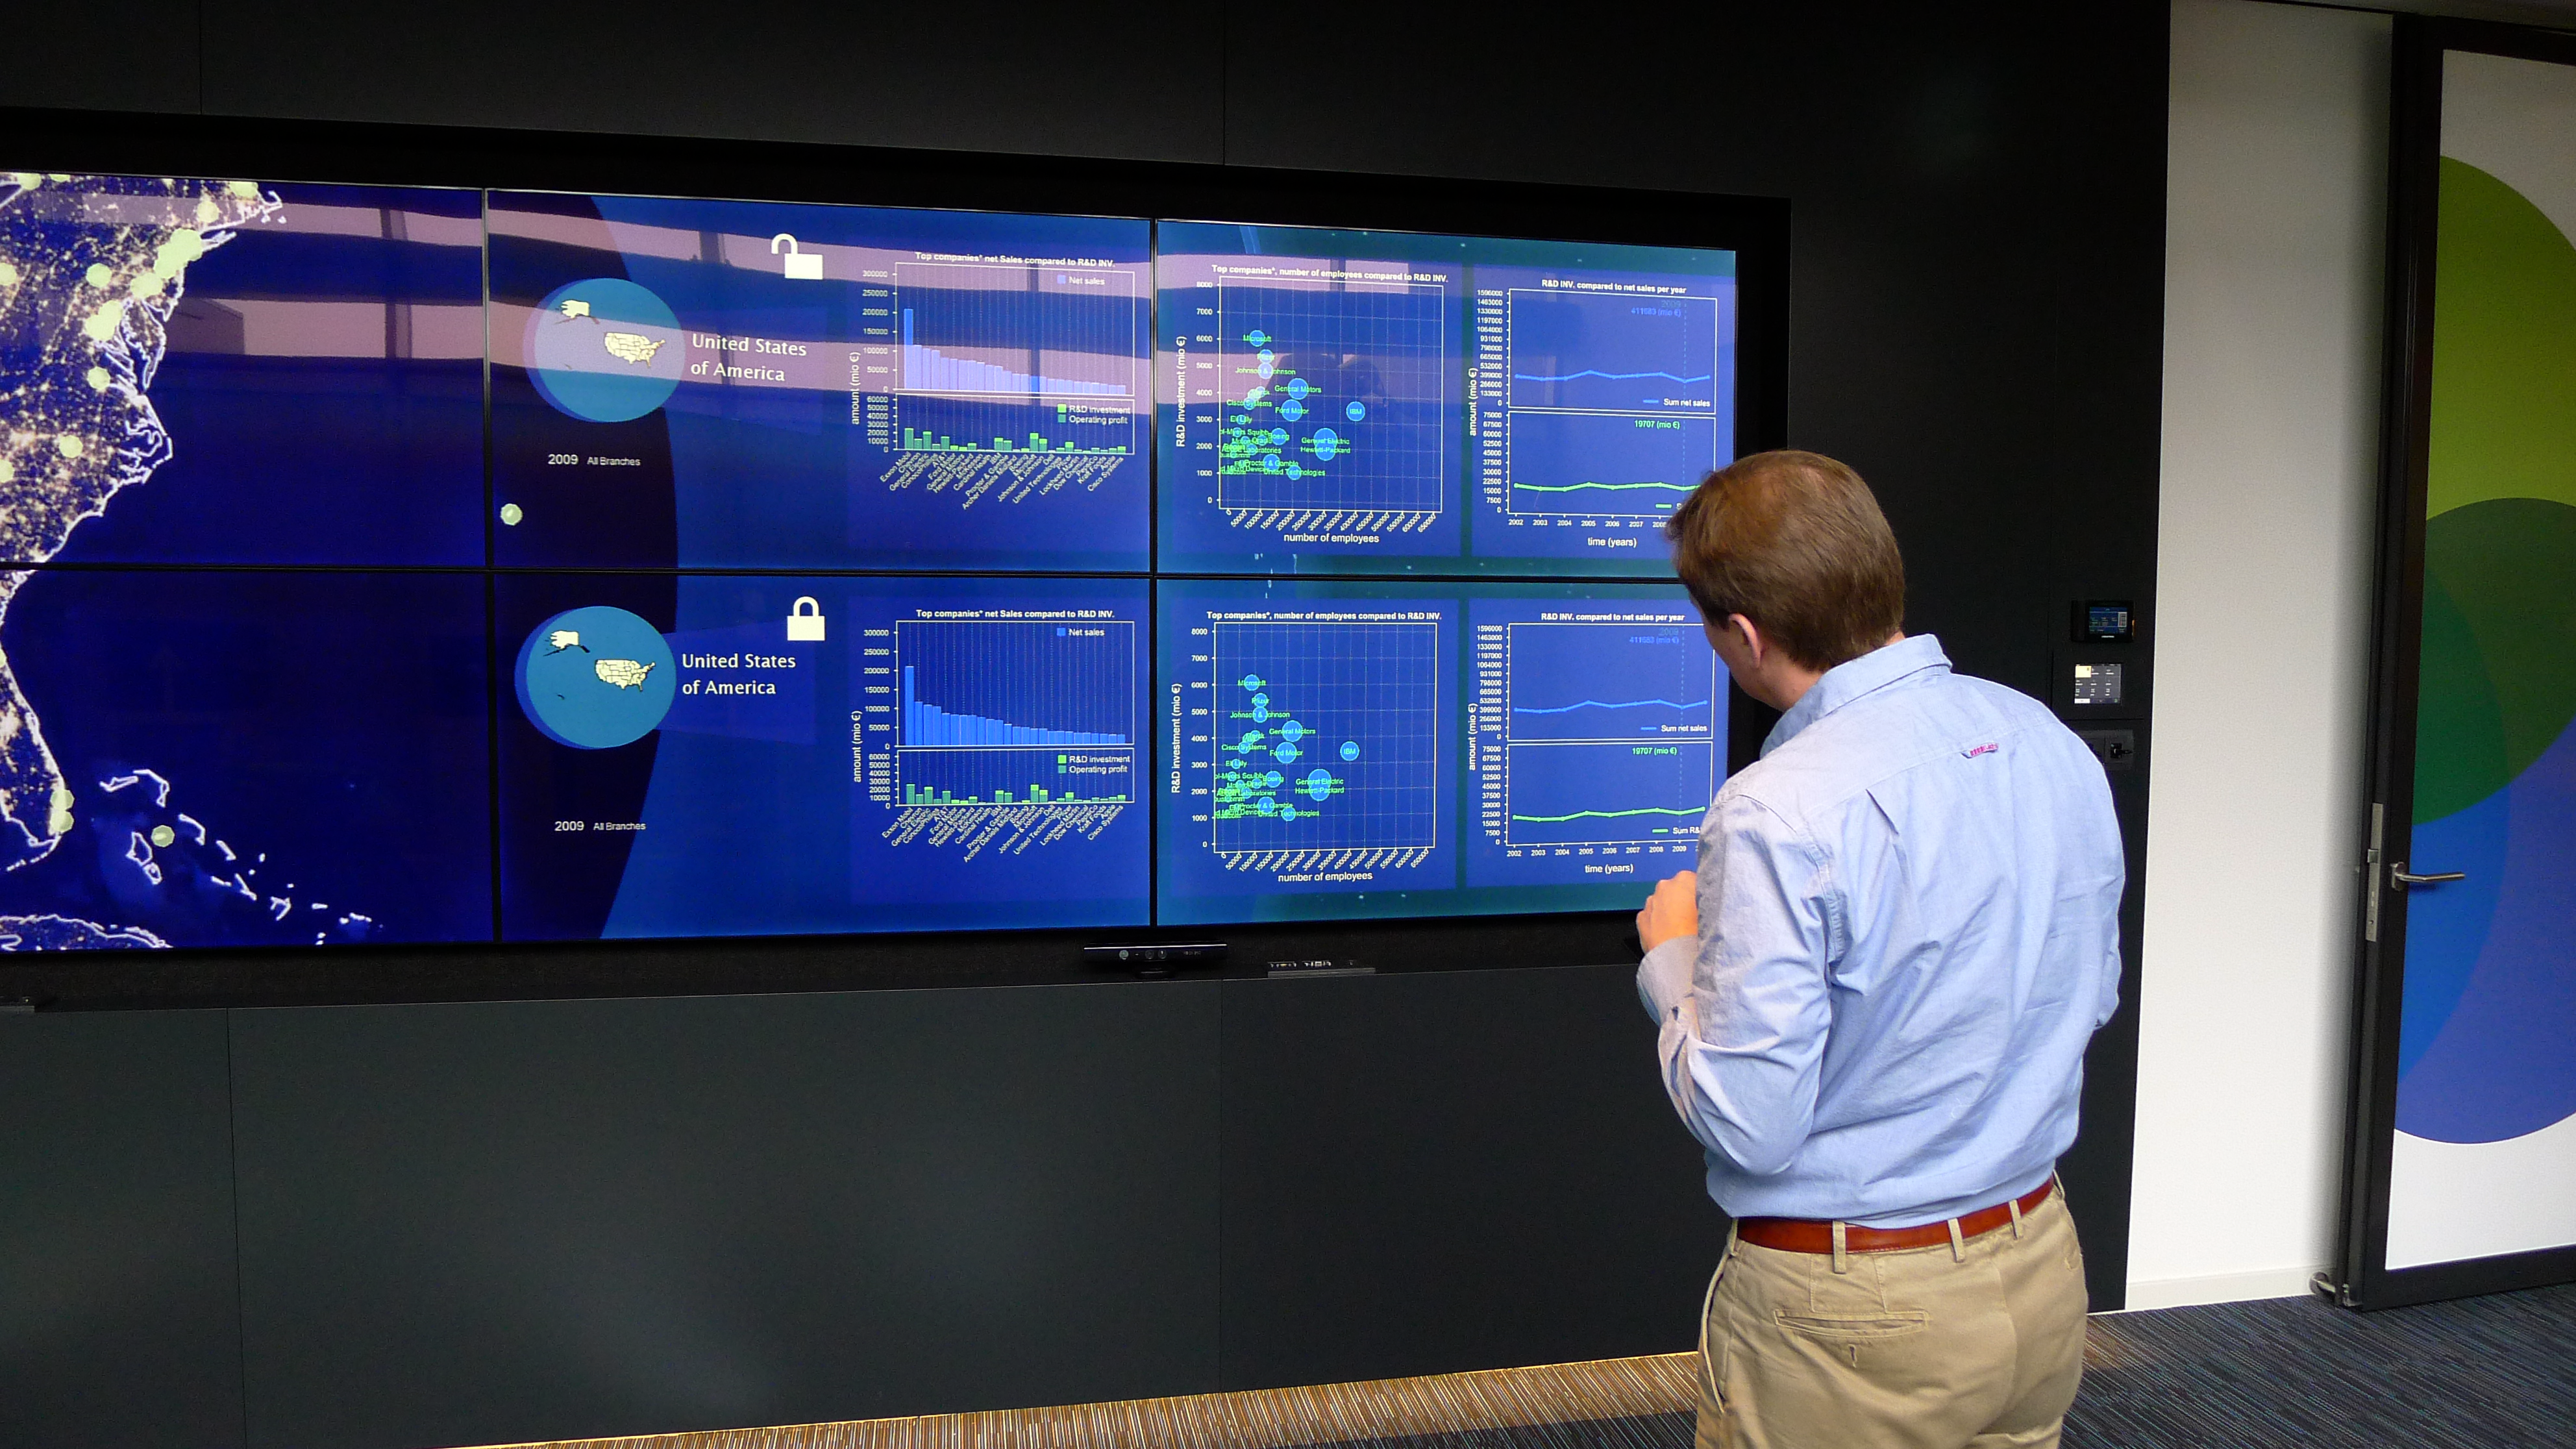
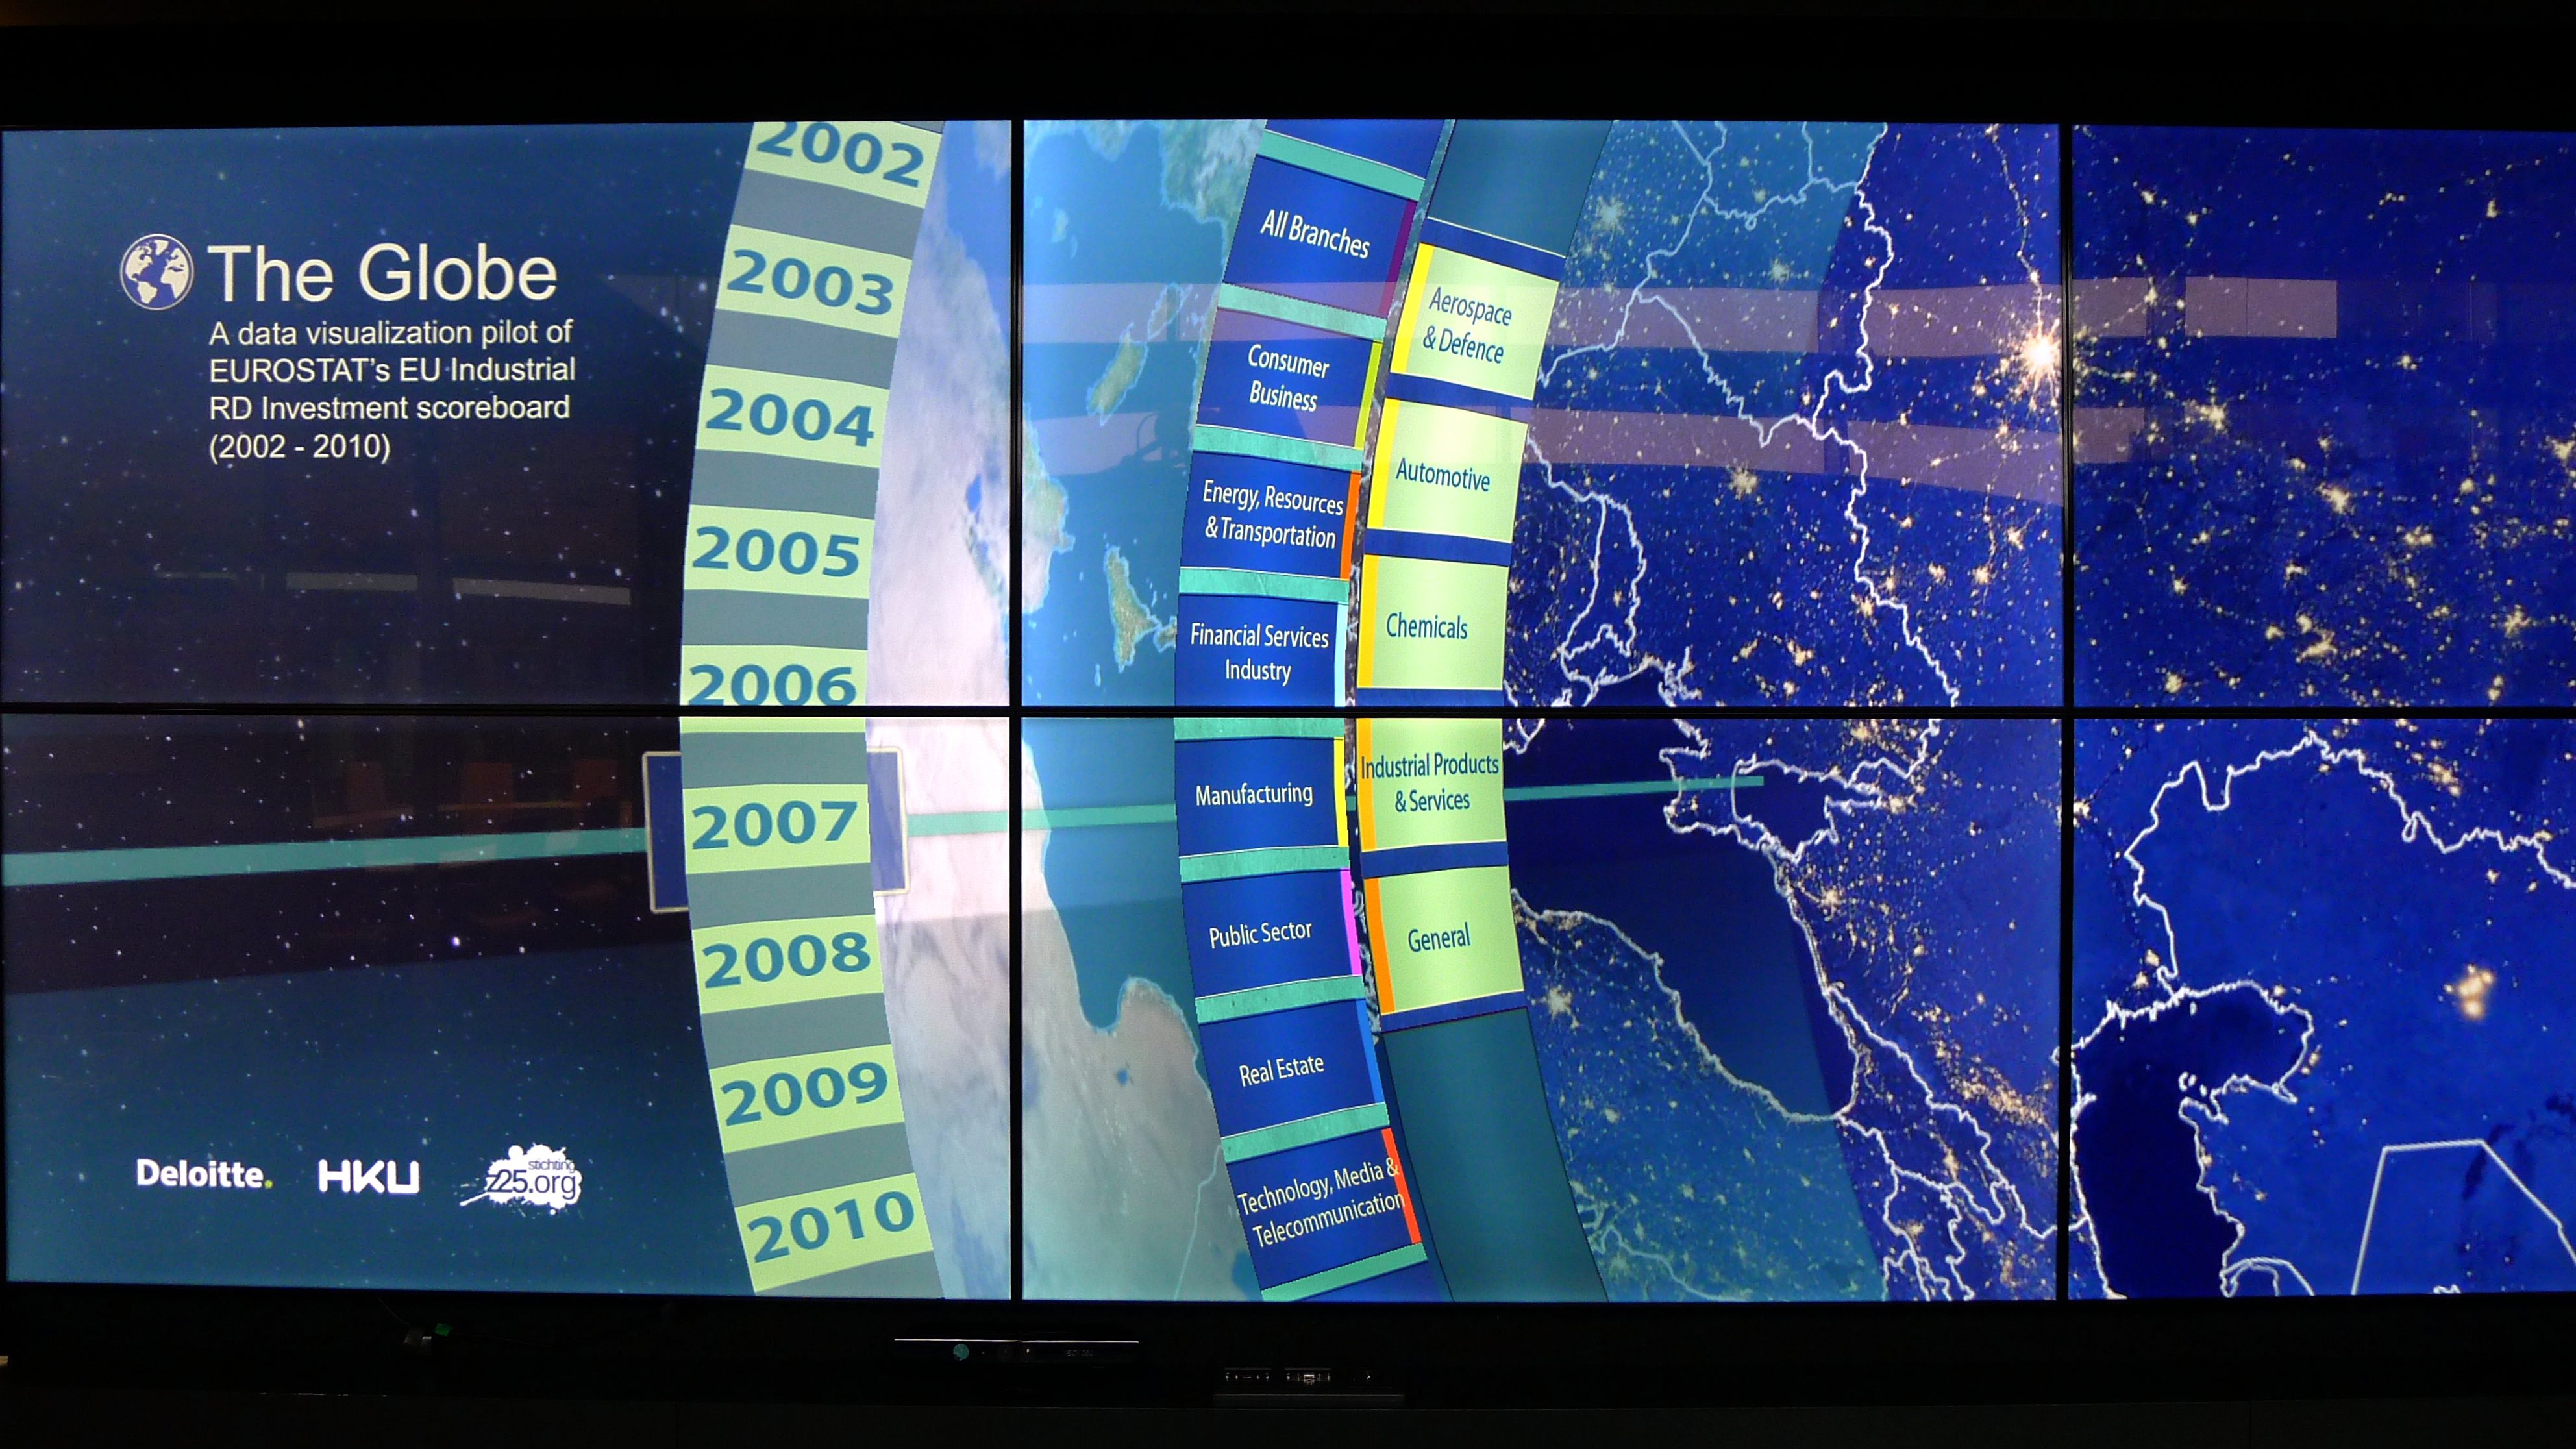
We created a concept for experiencing data interactively and immersively. For this pilot we used open data from Eurostat consisting of EU Industrial R&D Investment ScoreBoard from 2002 until 2010.
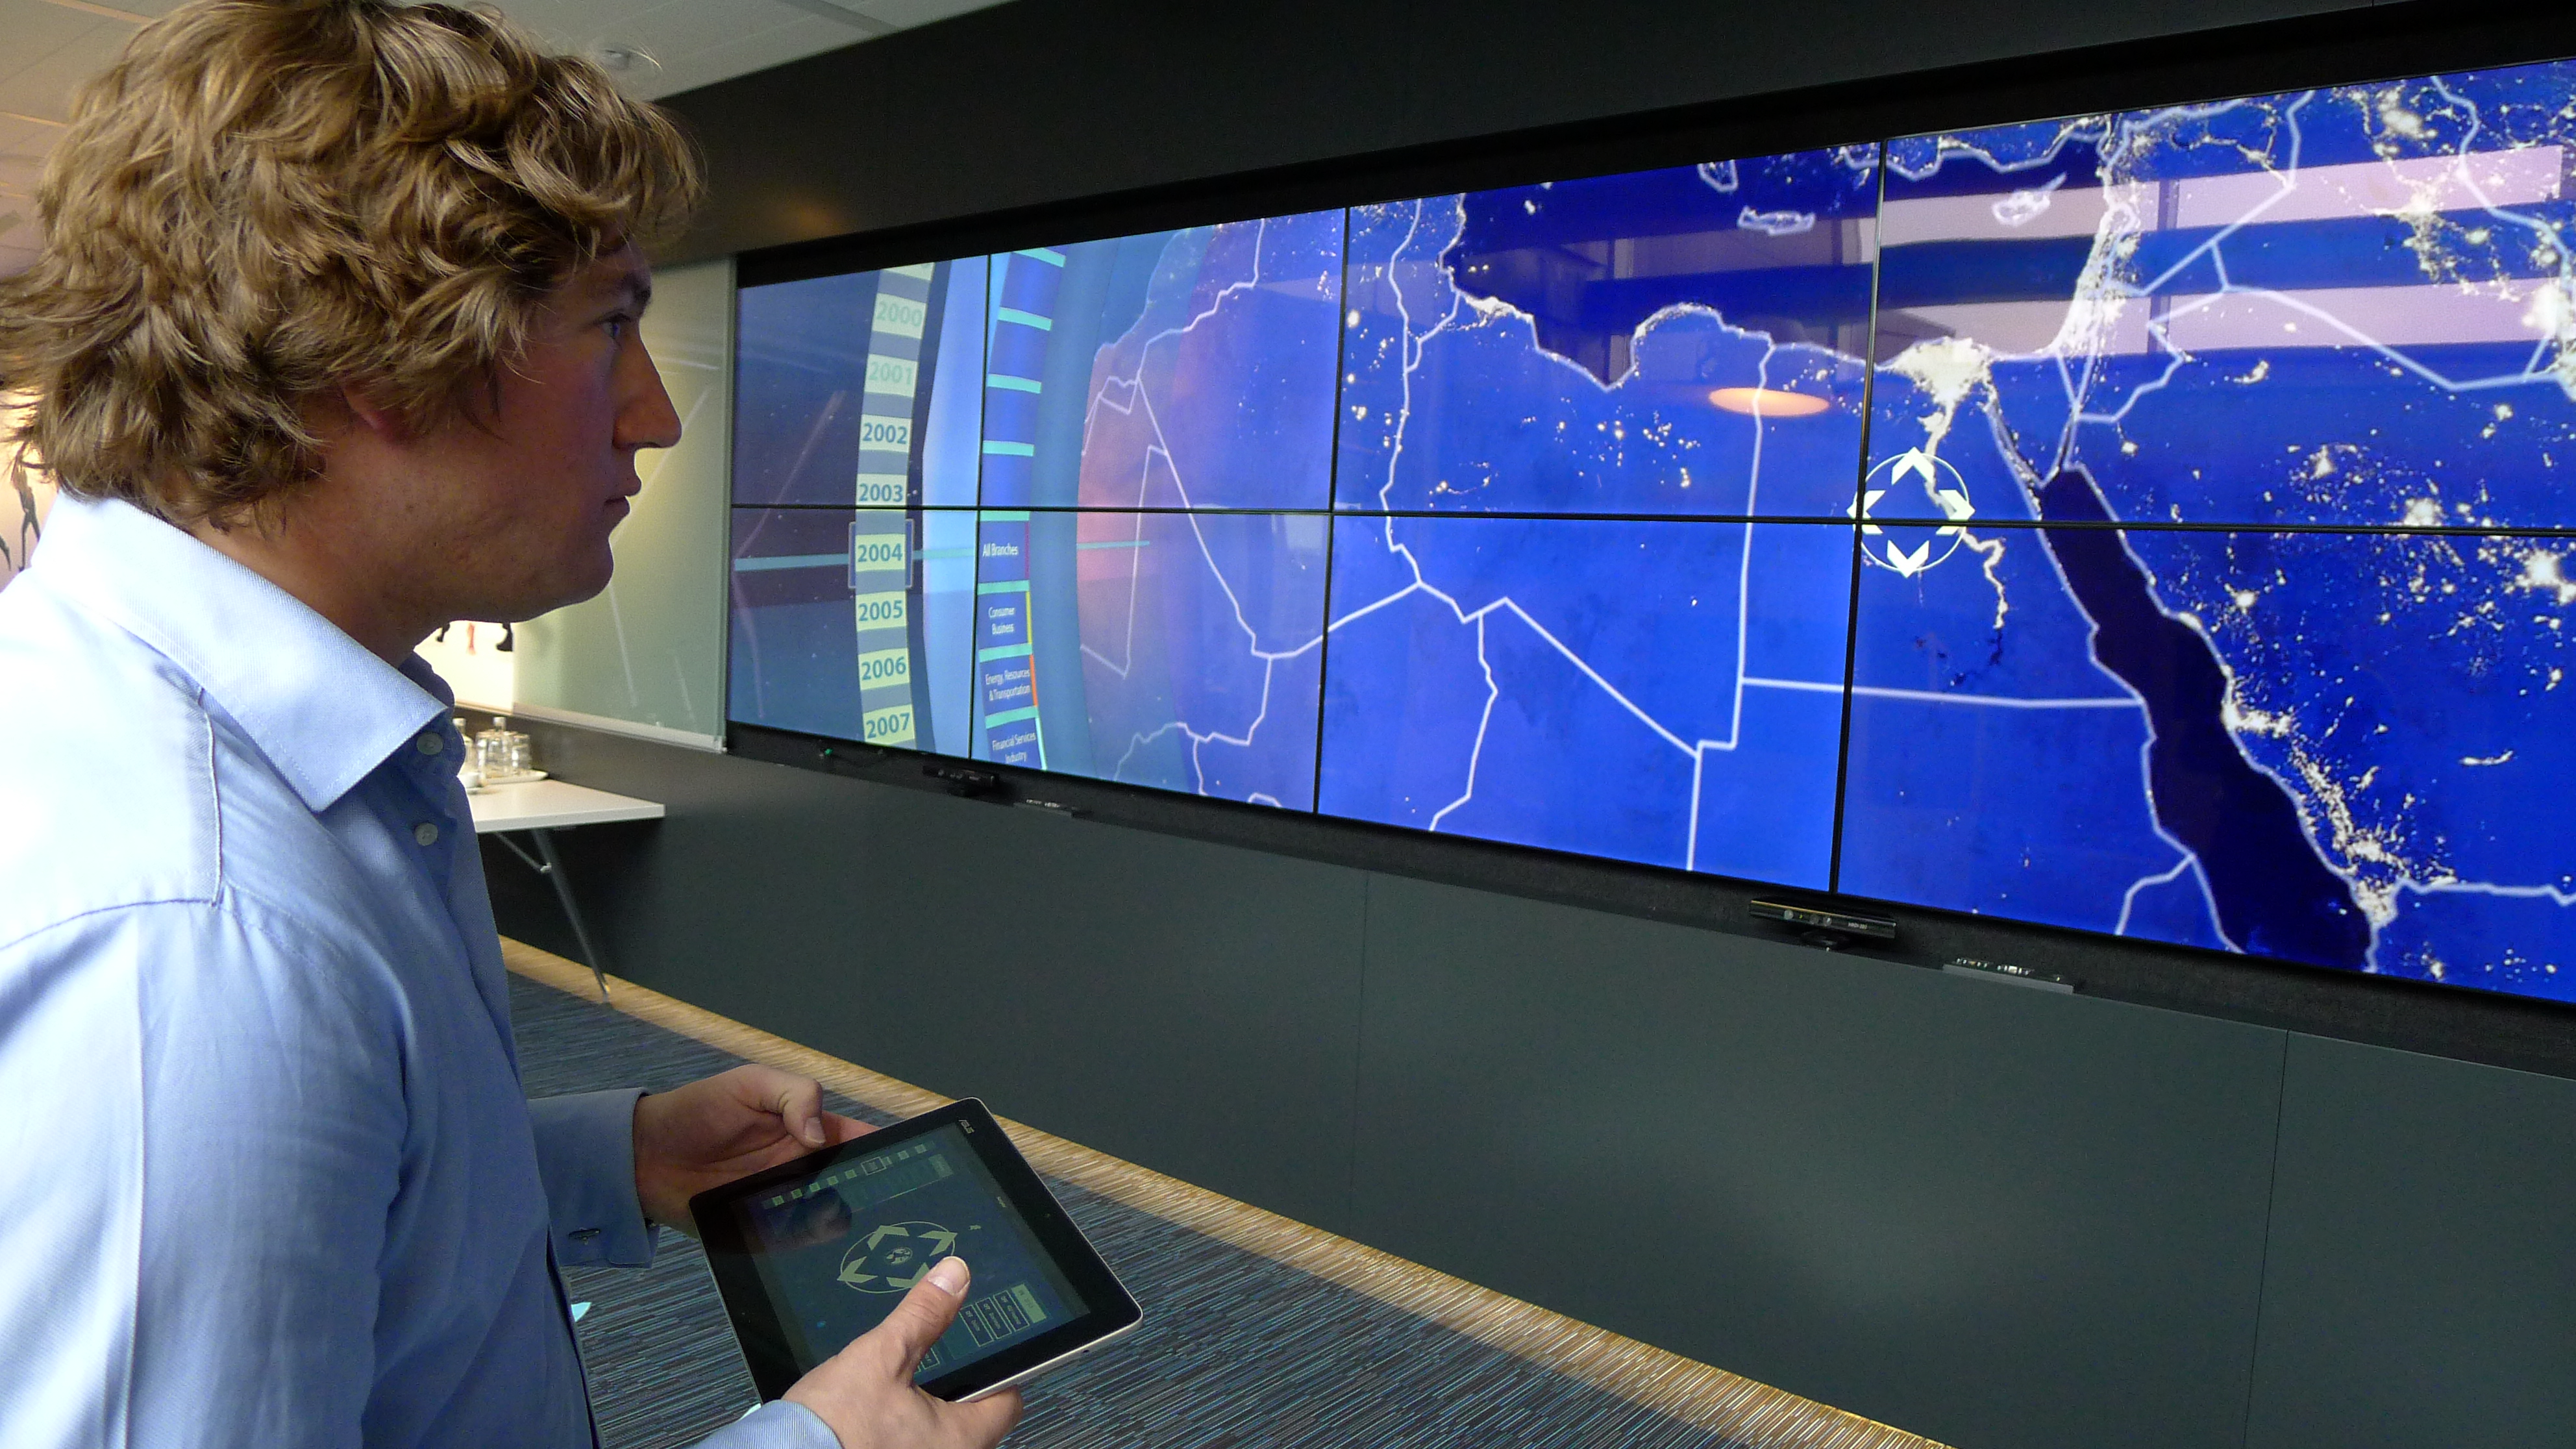
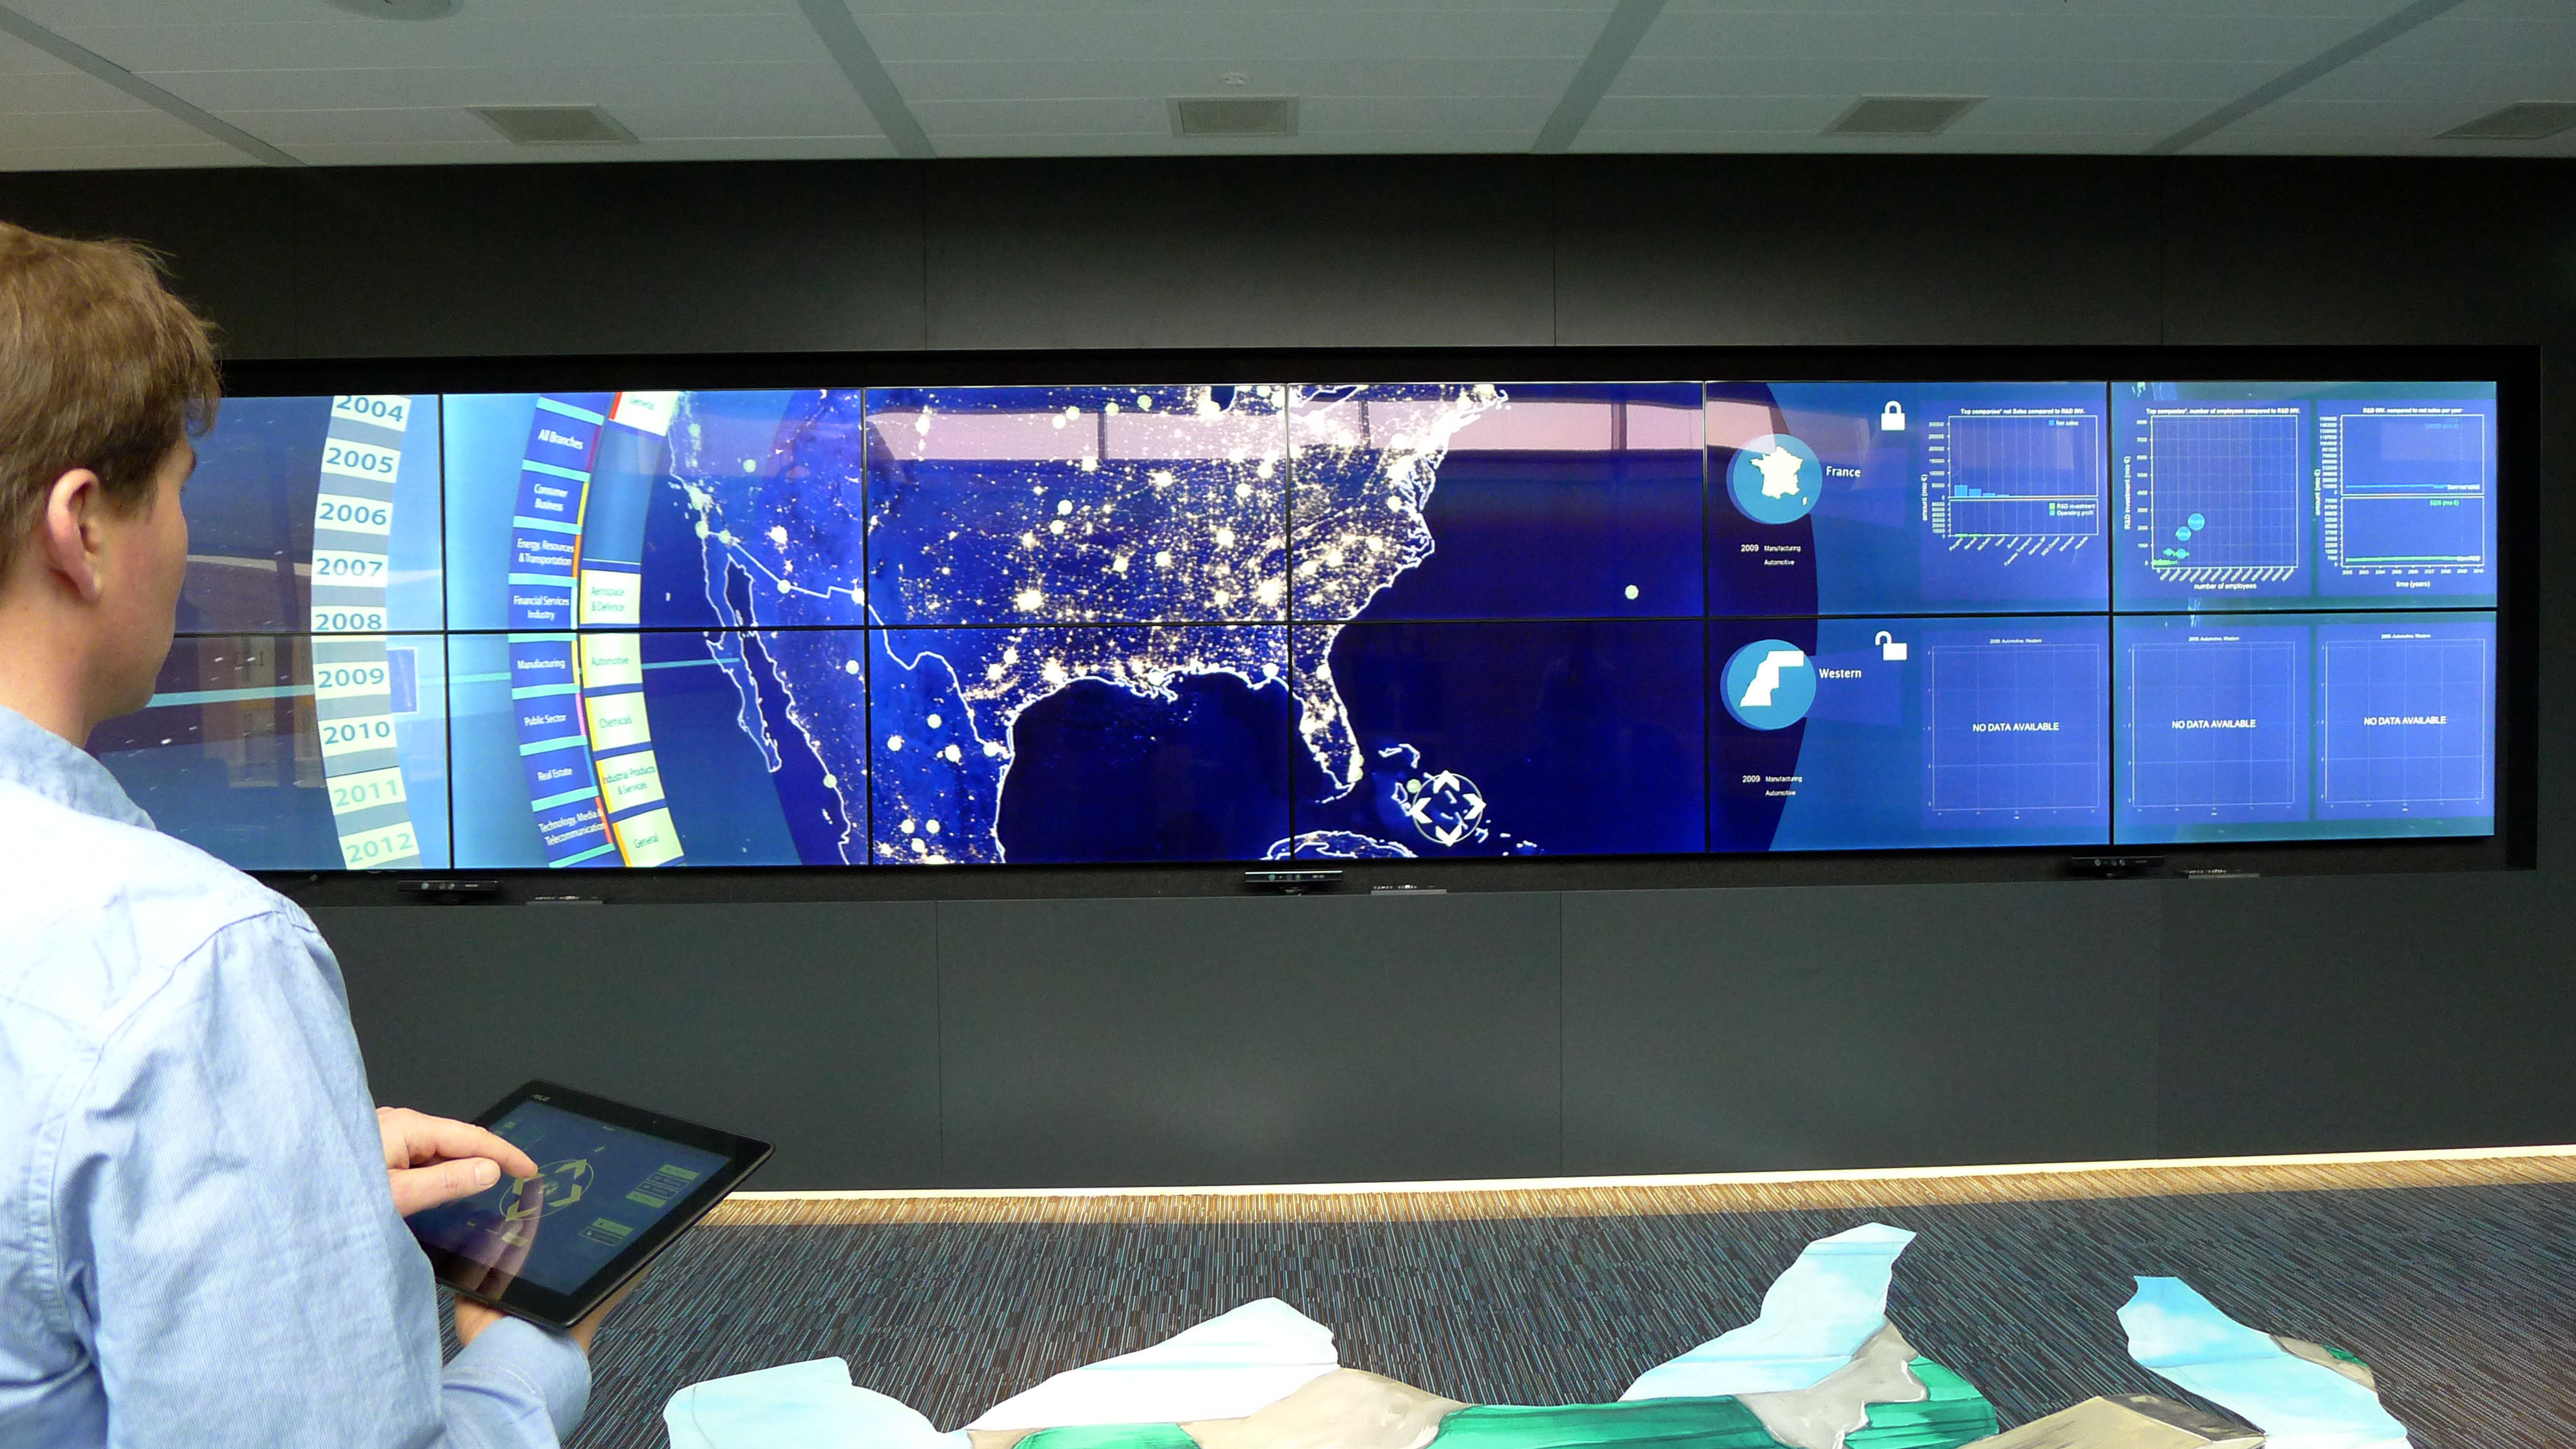
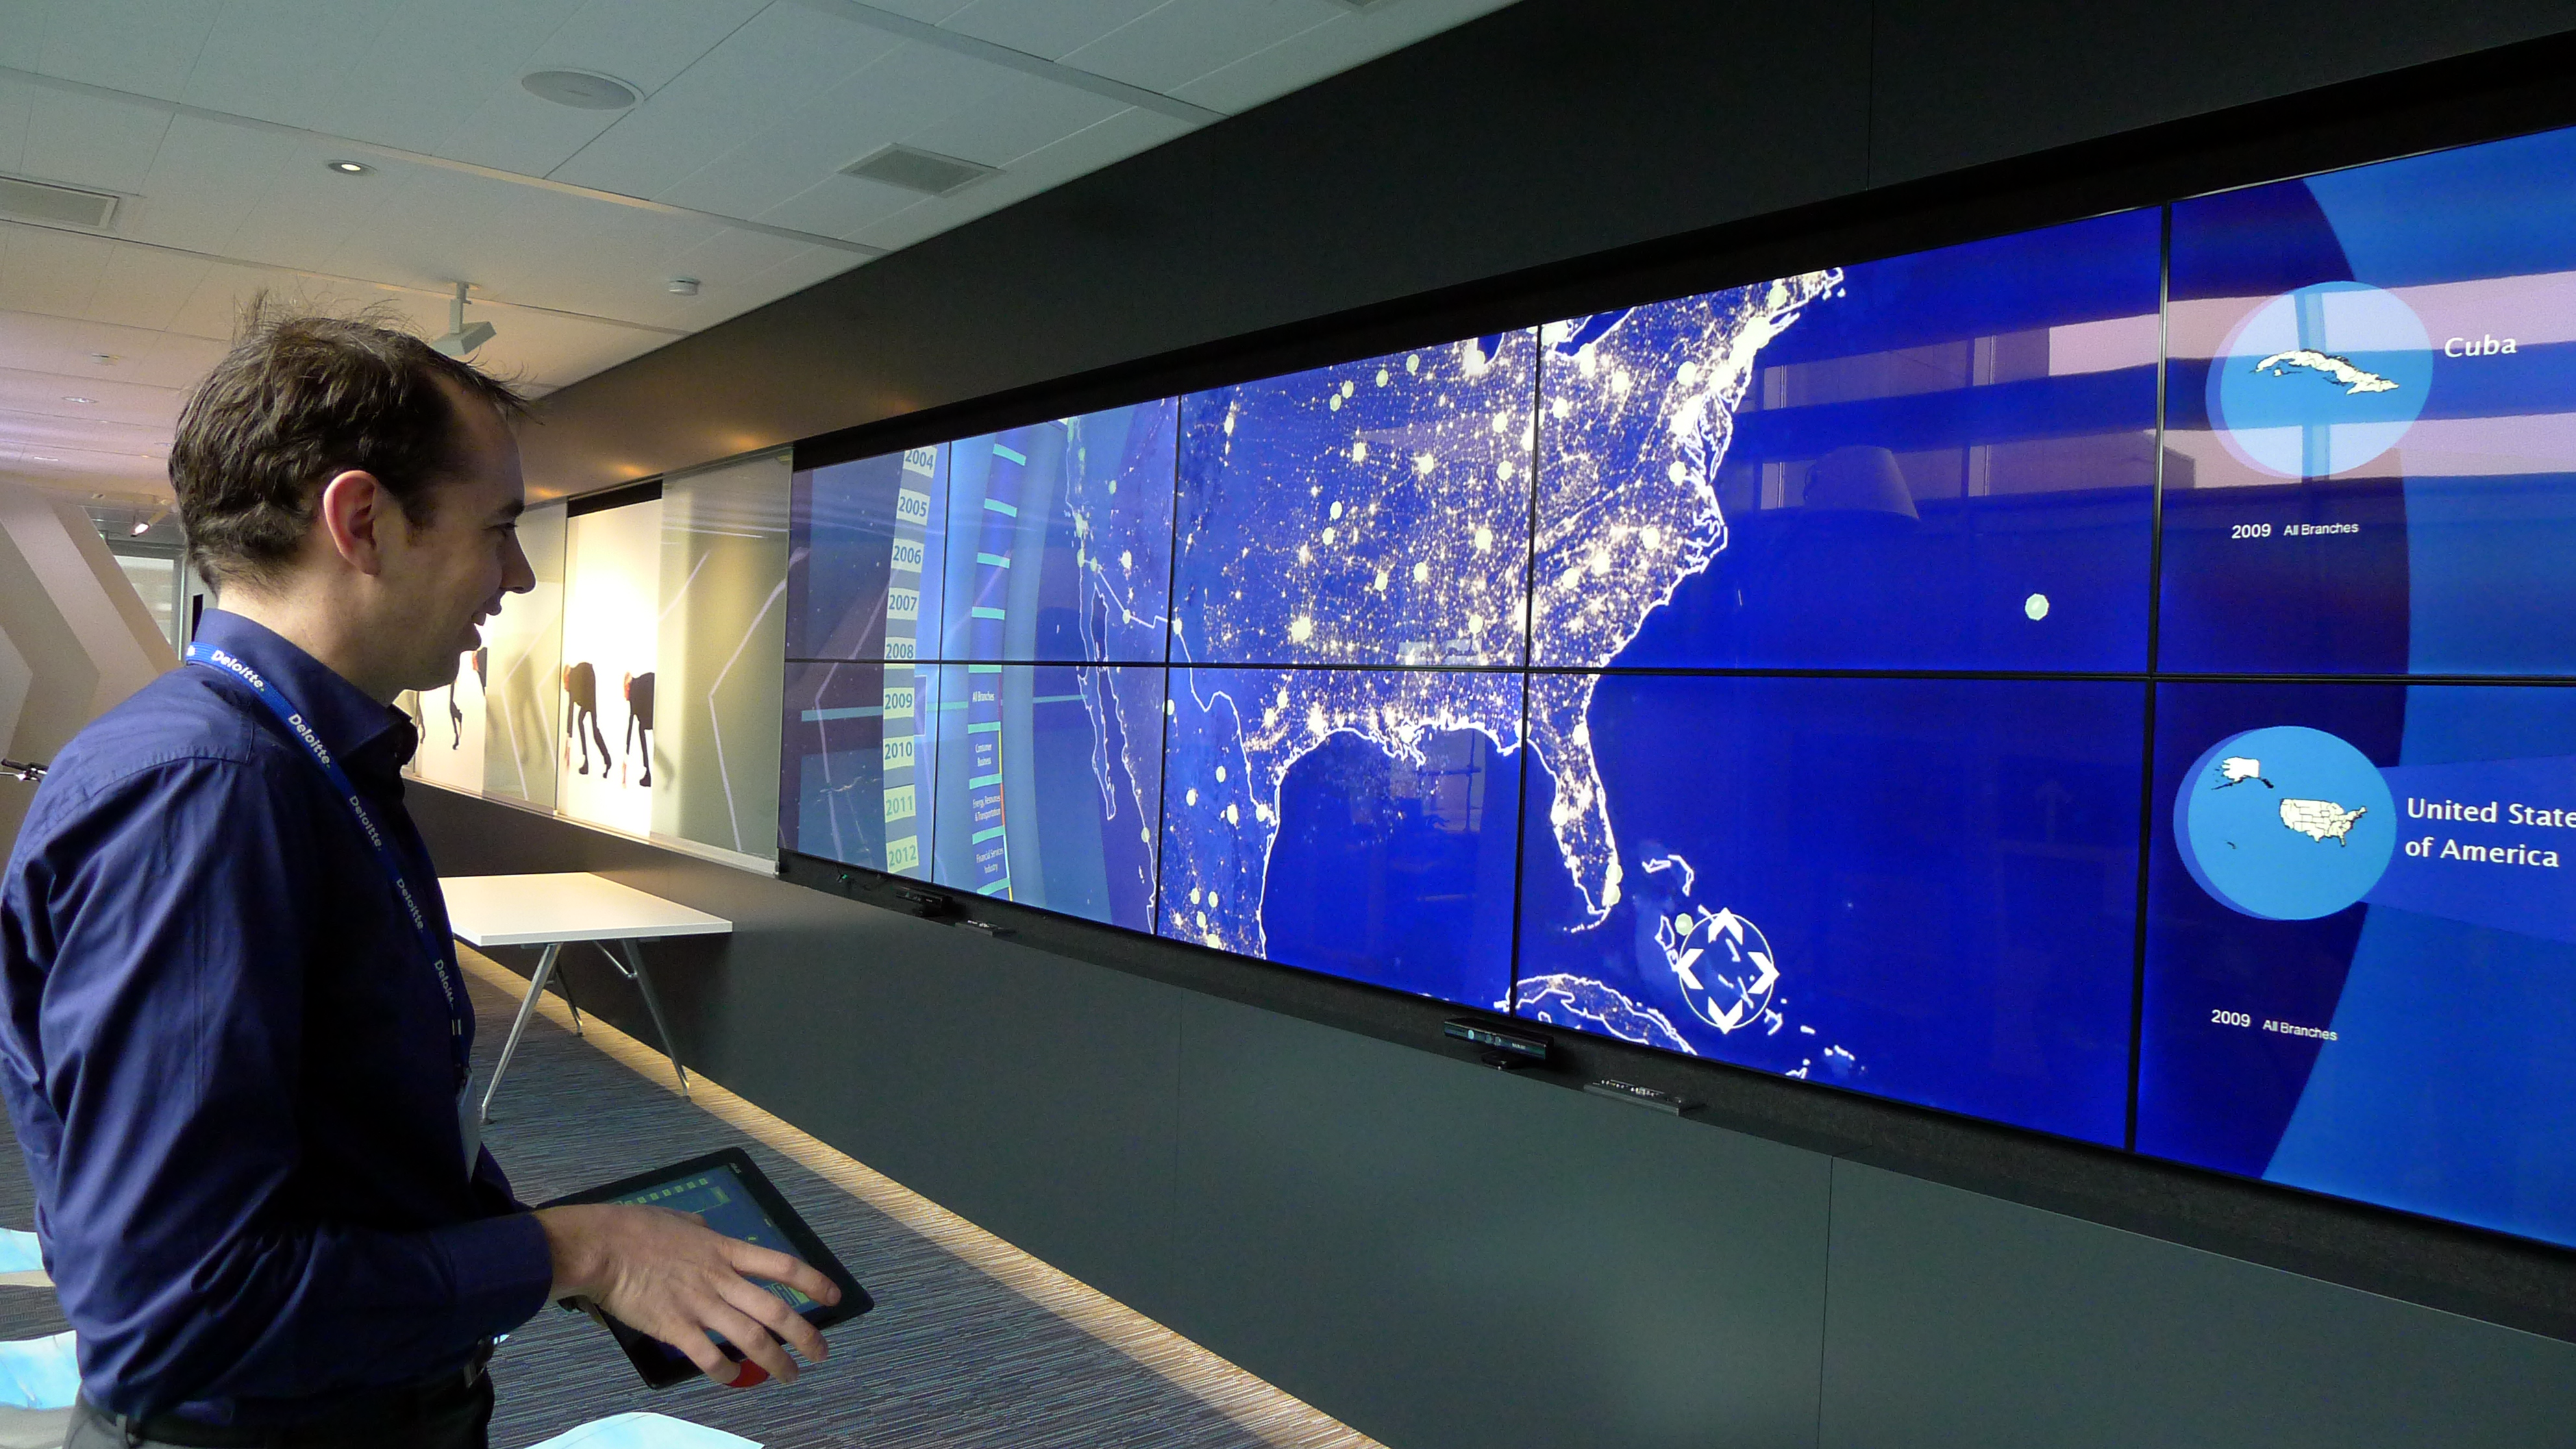
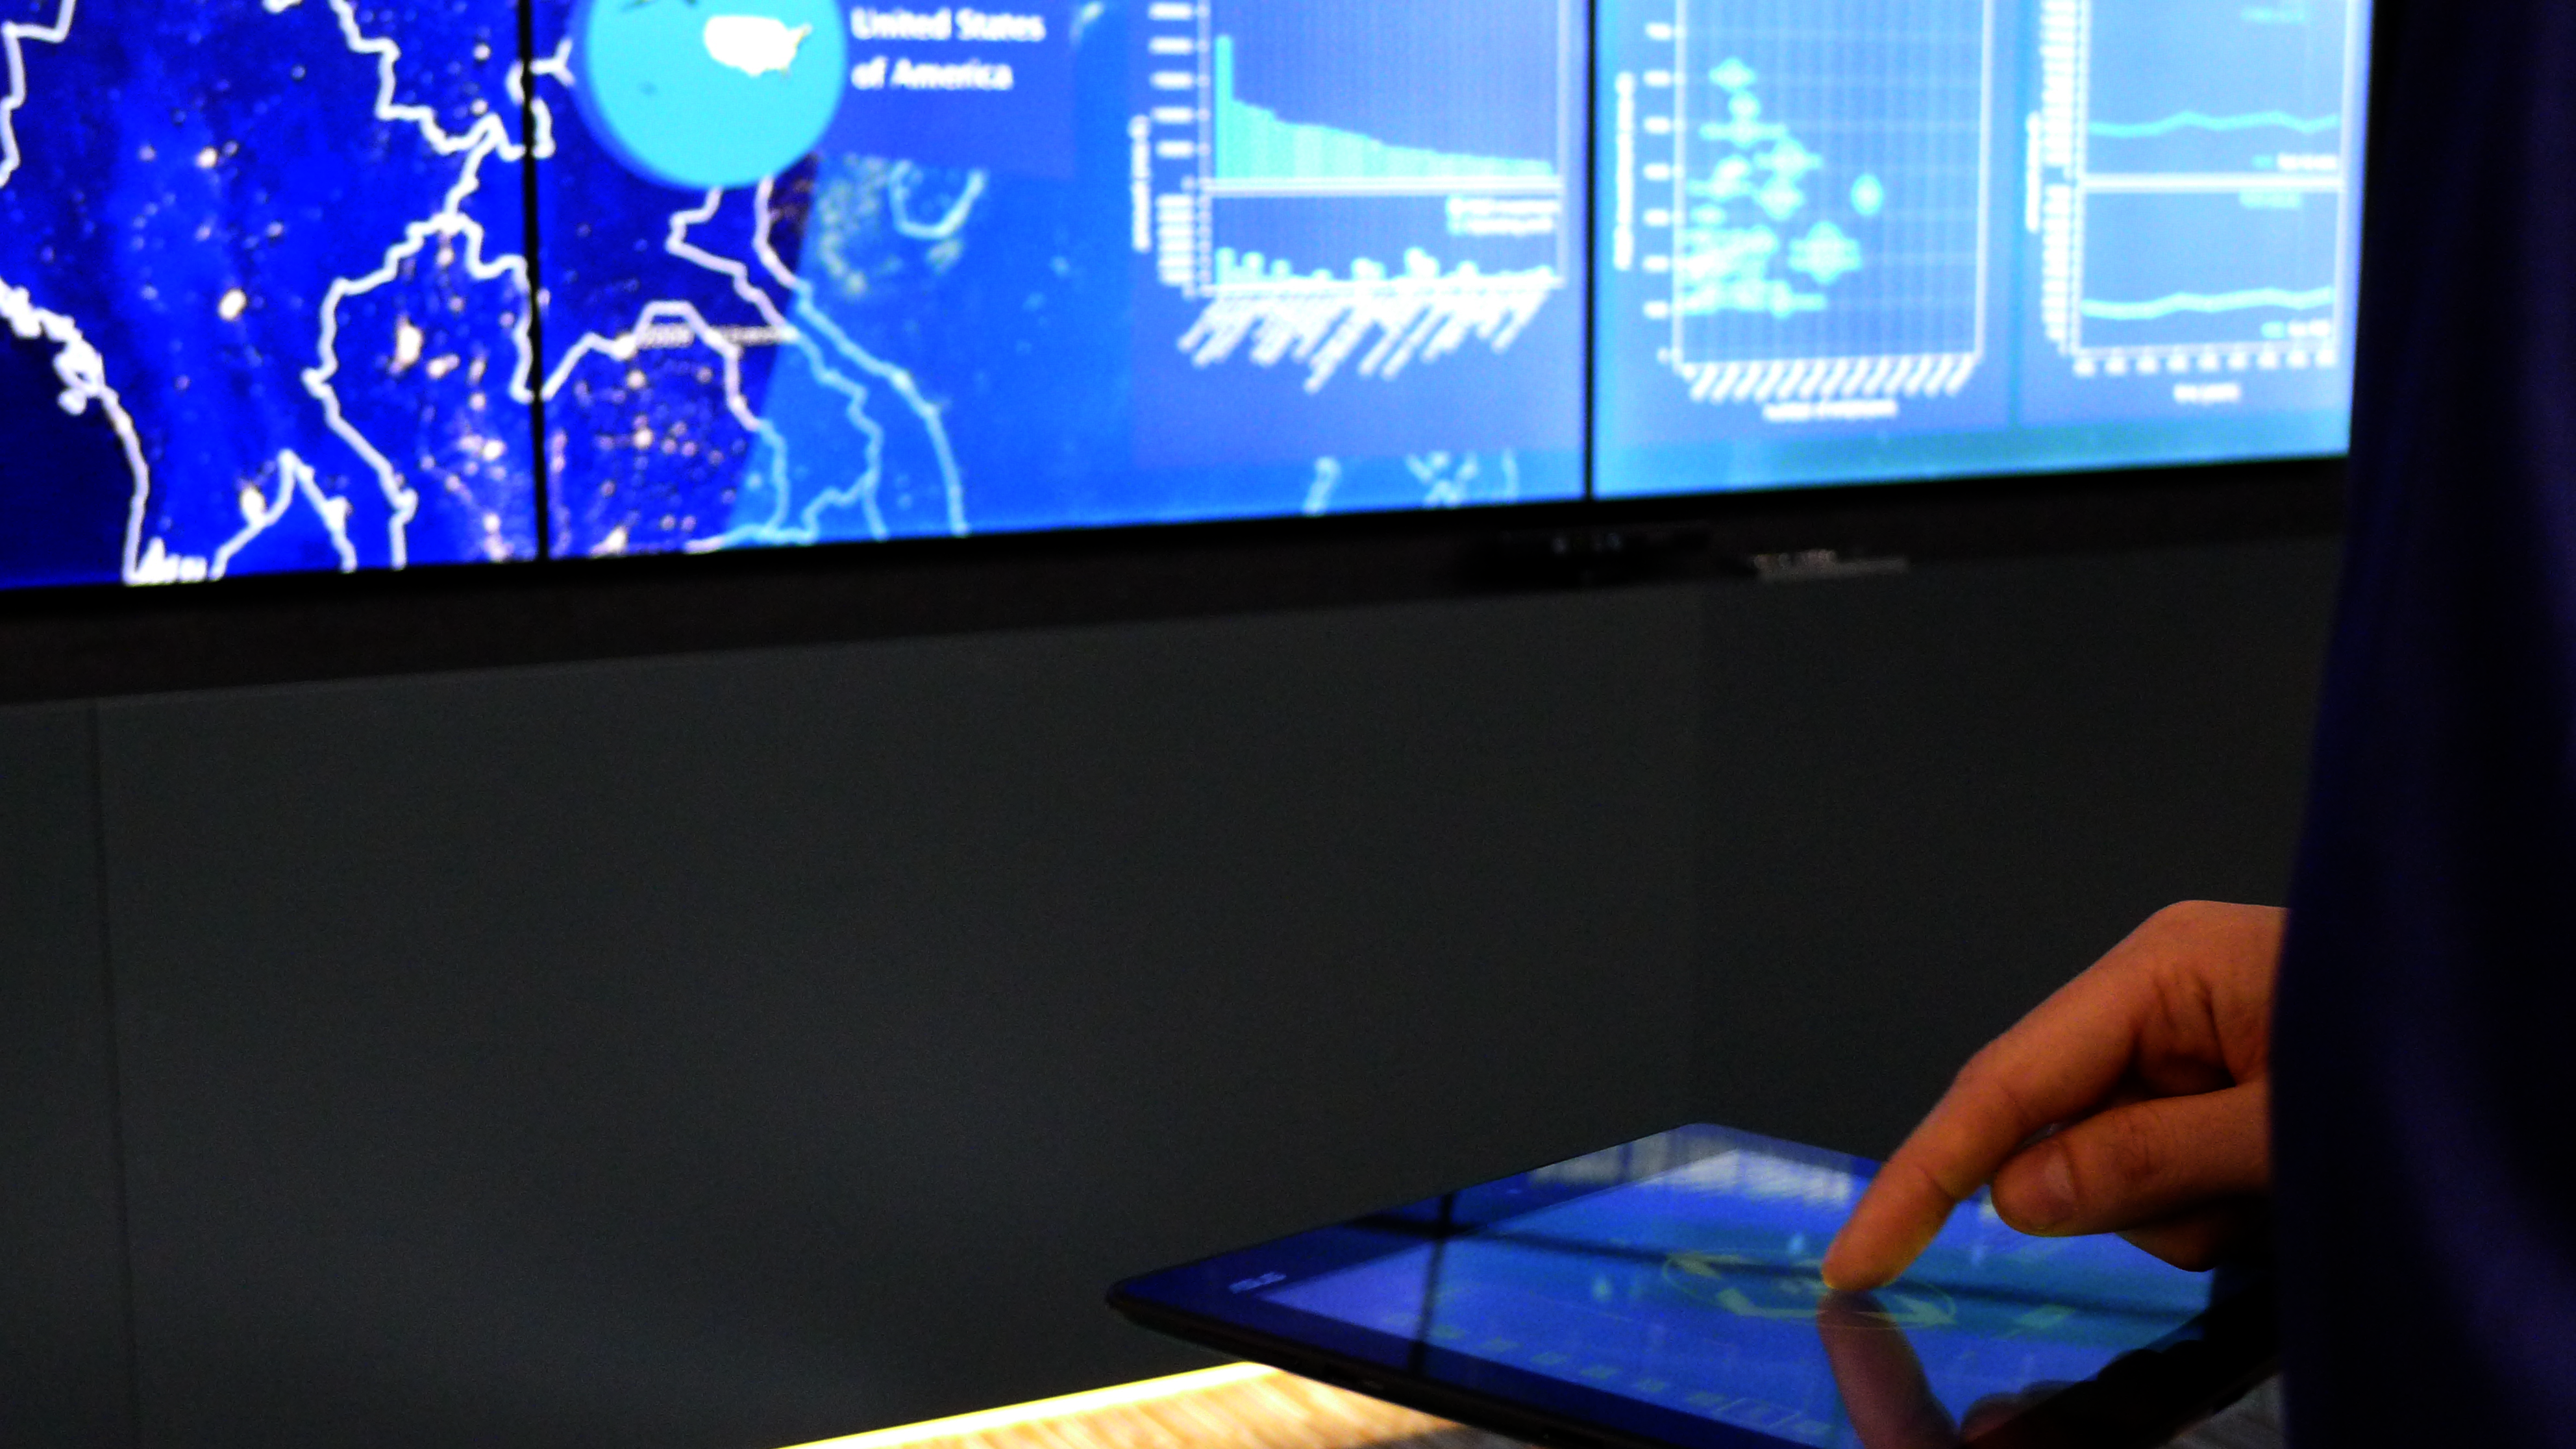
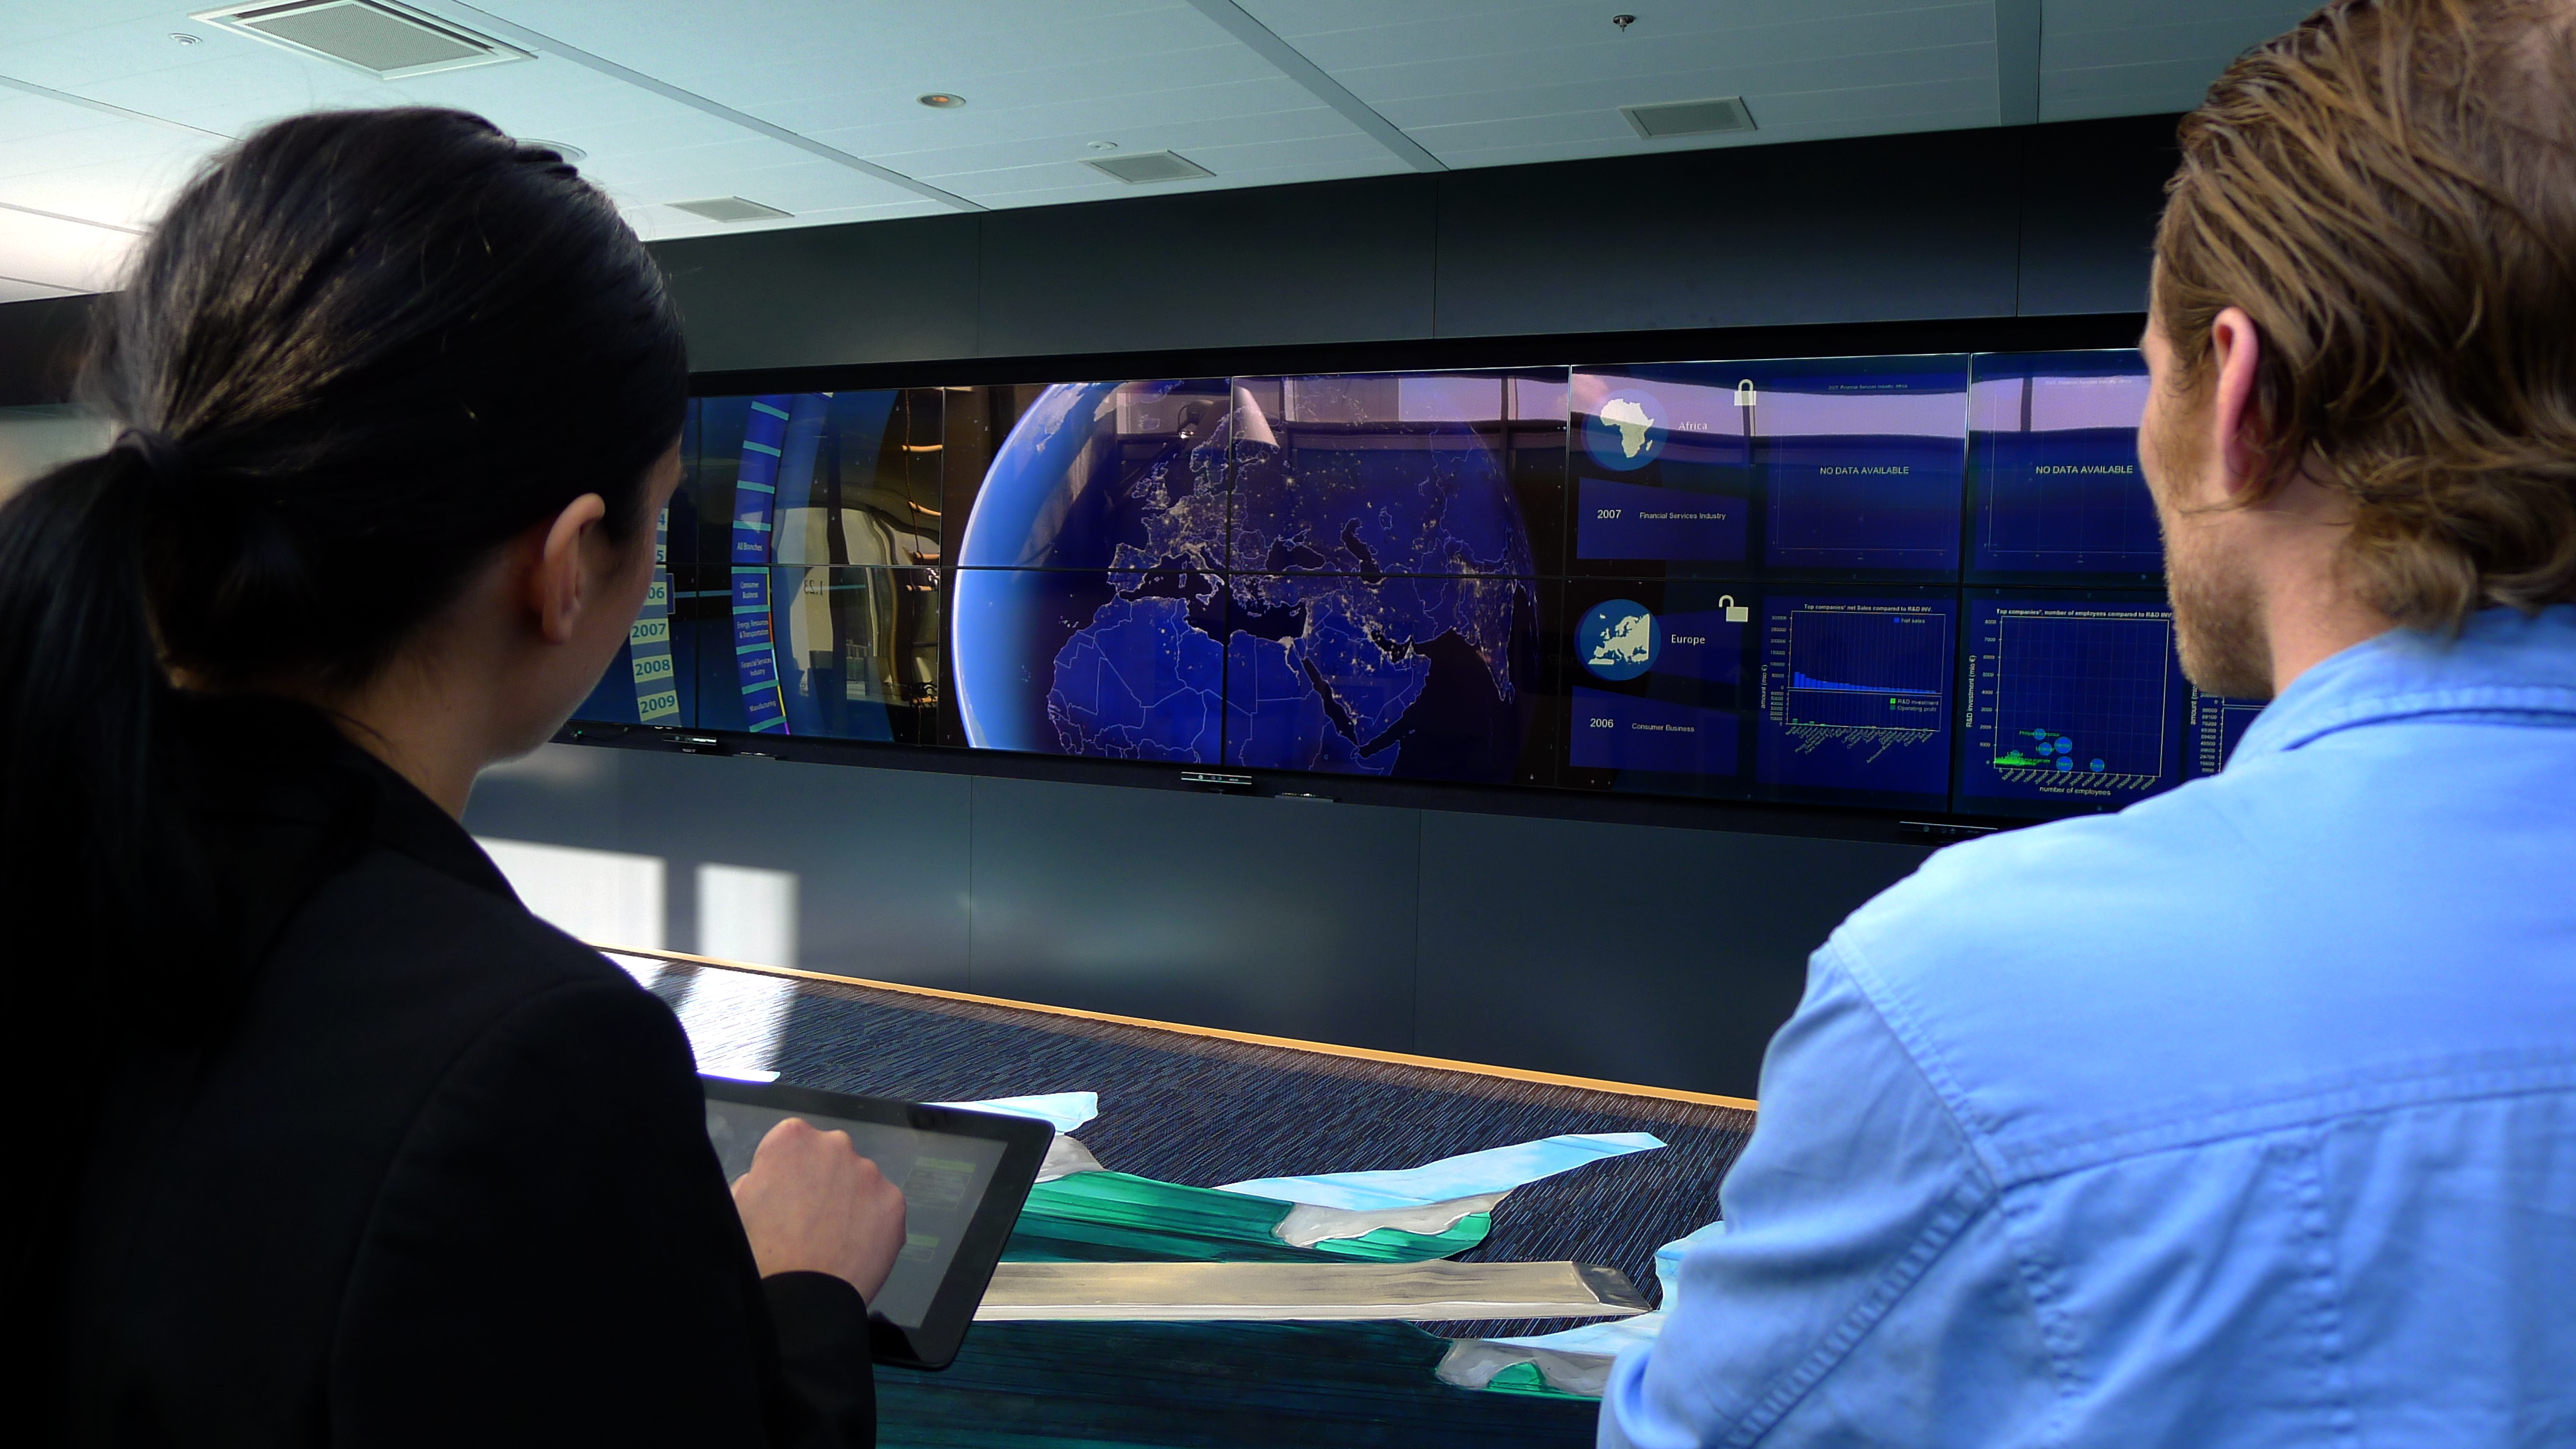
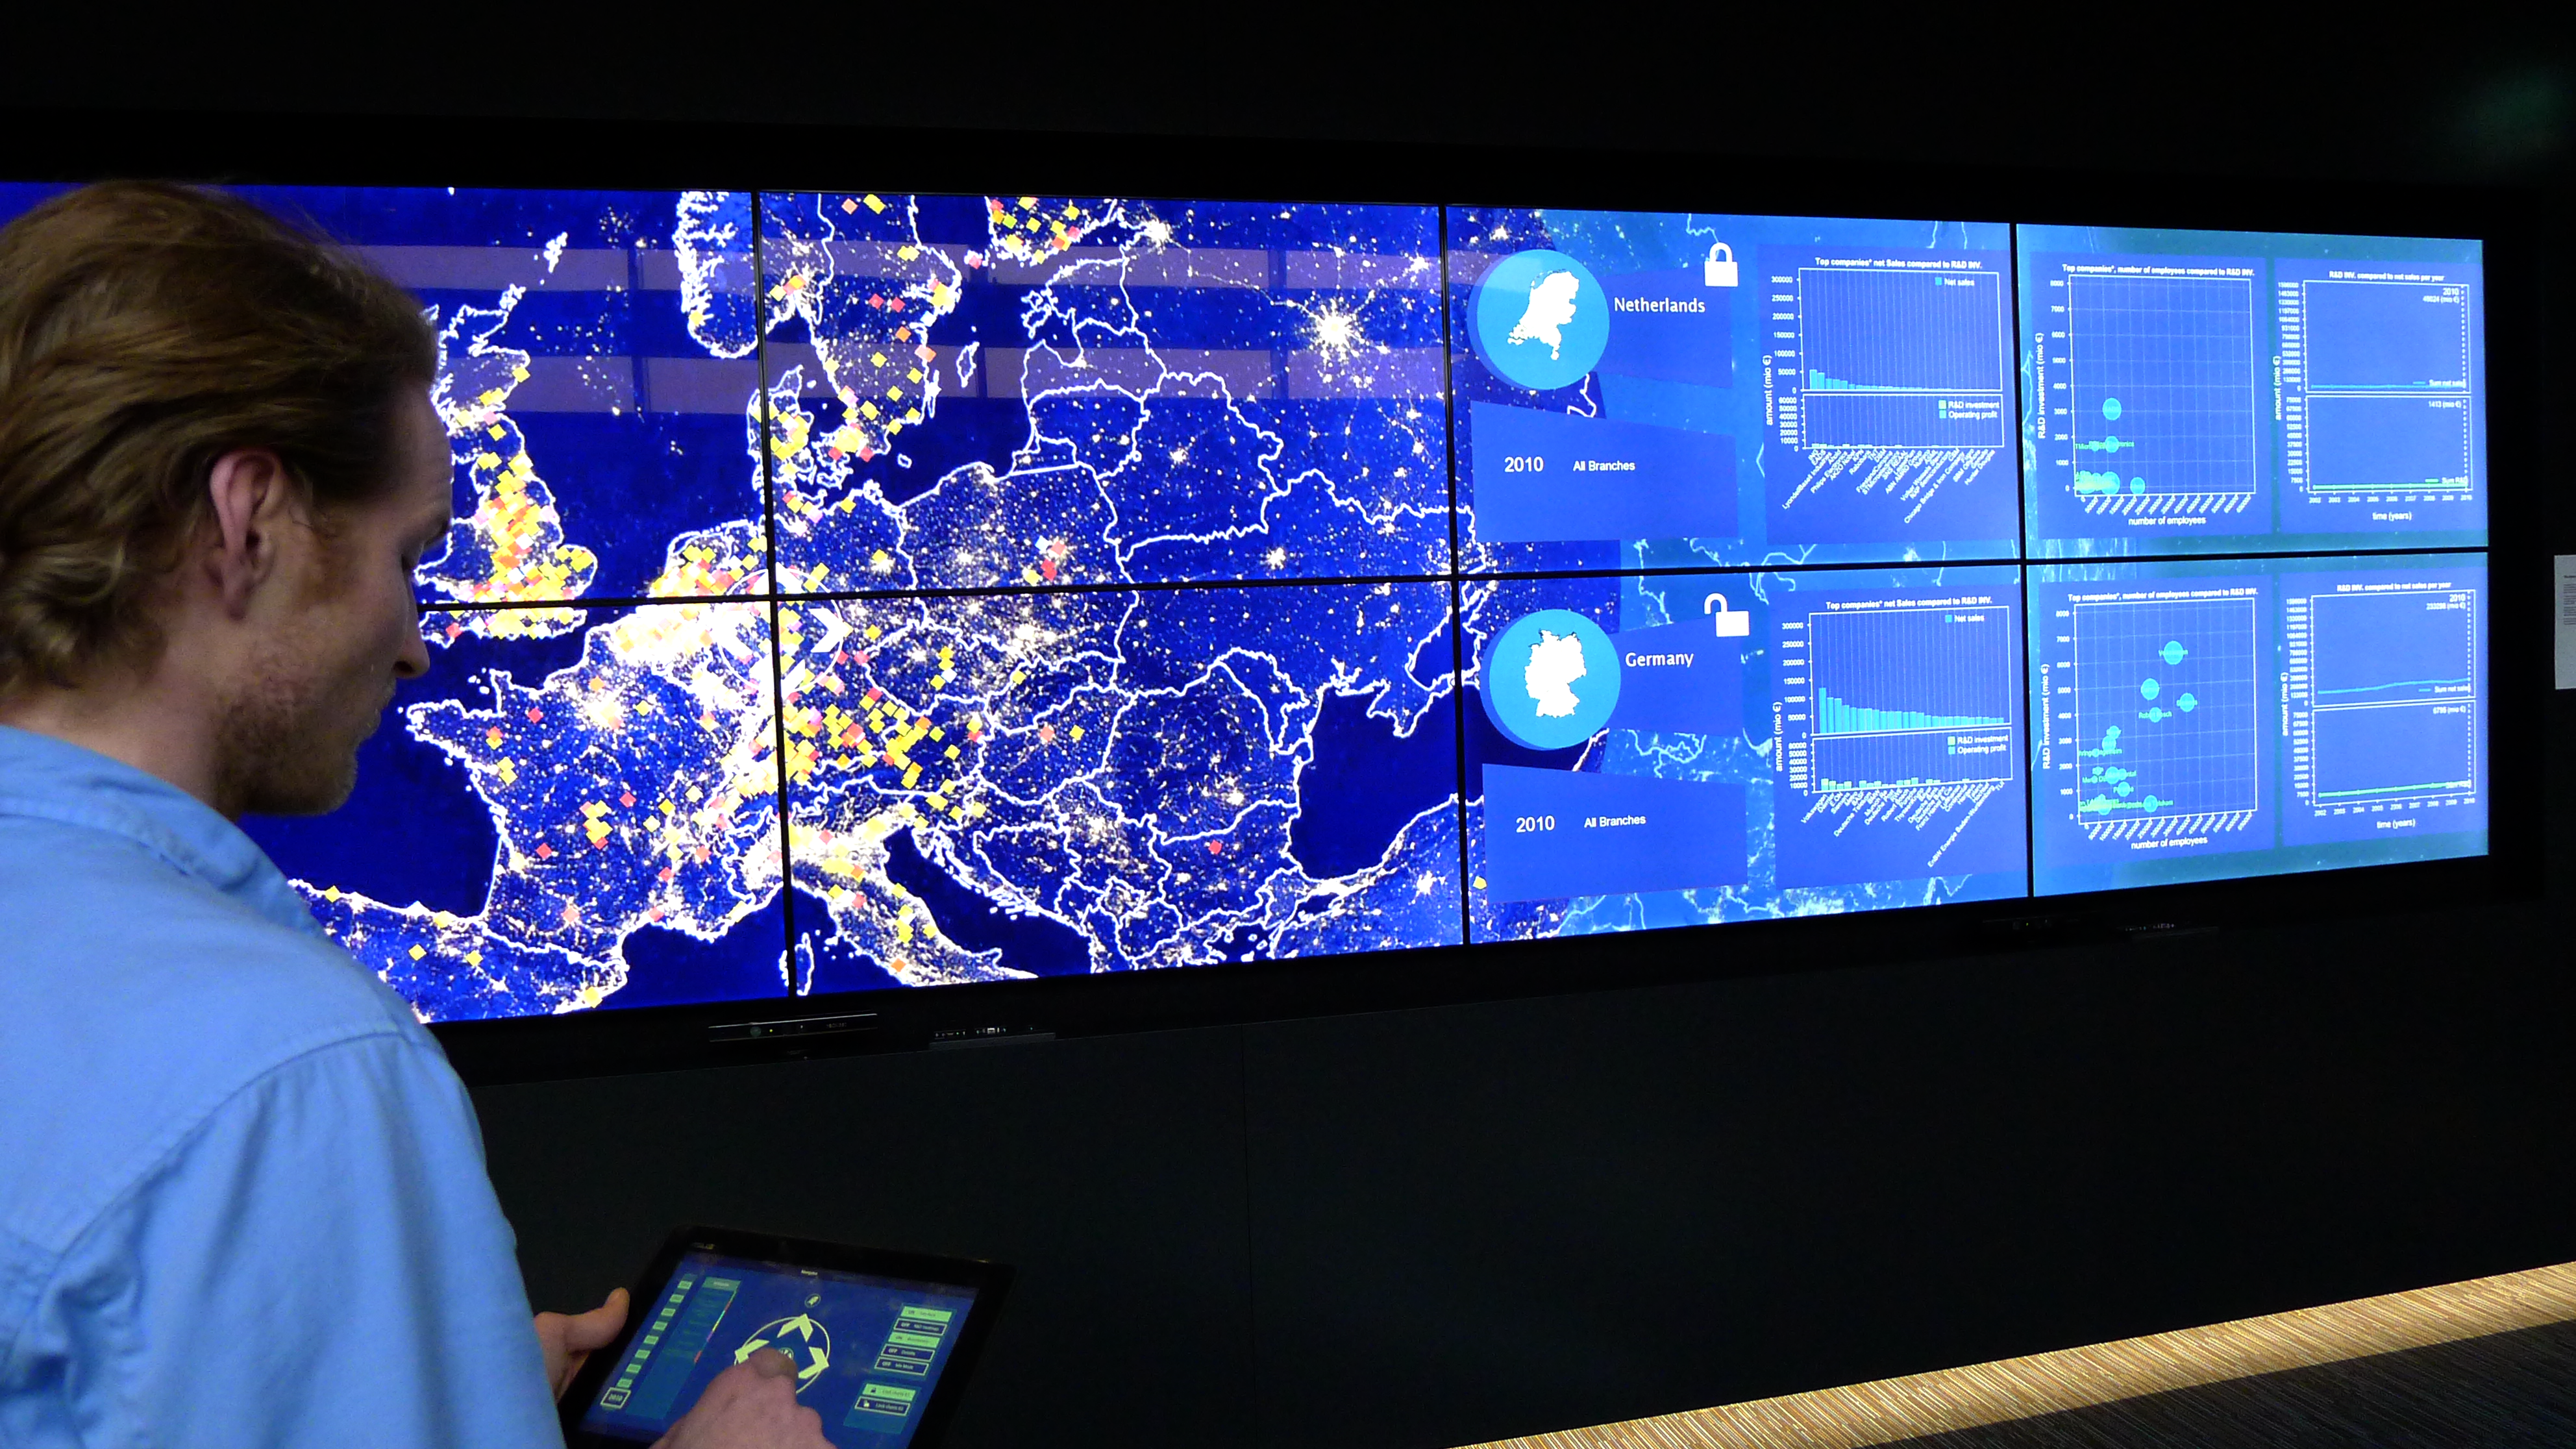
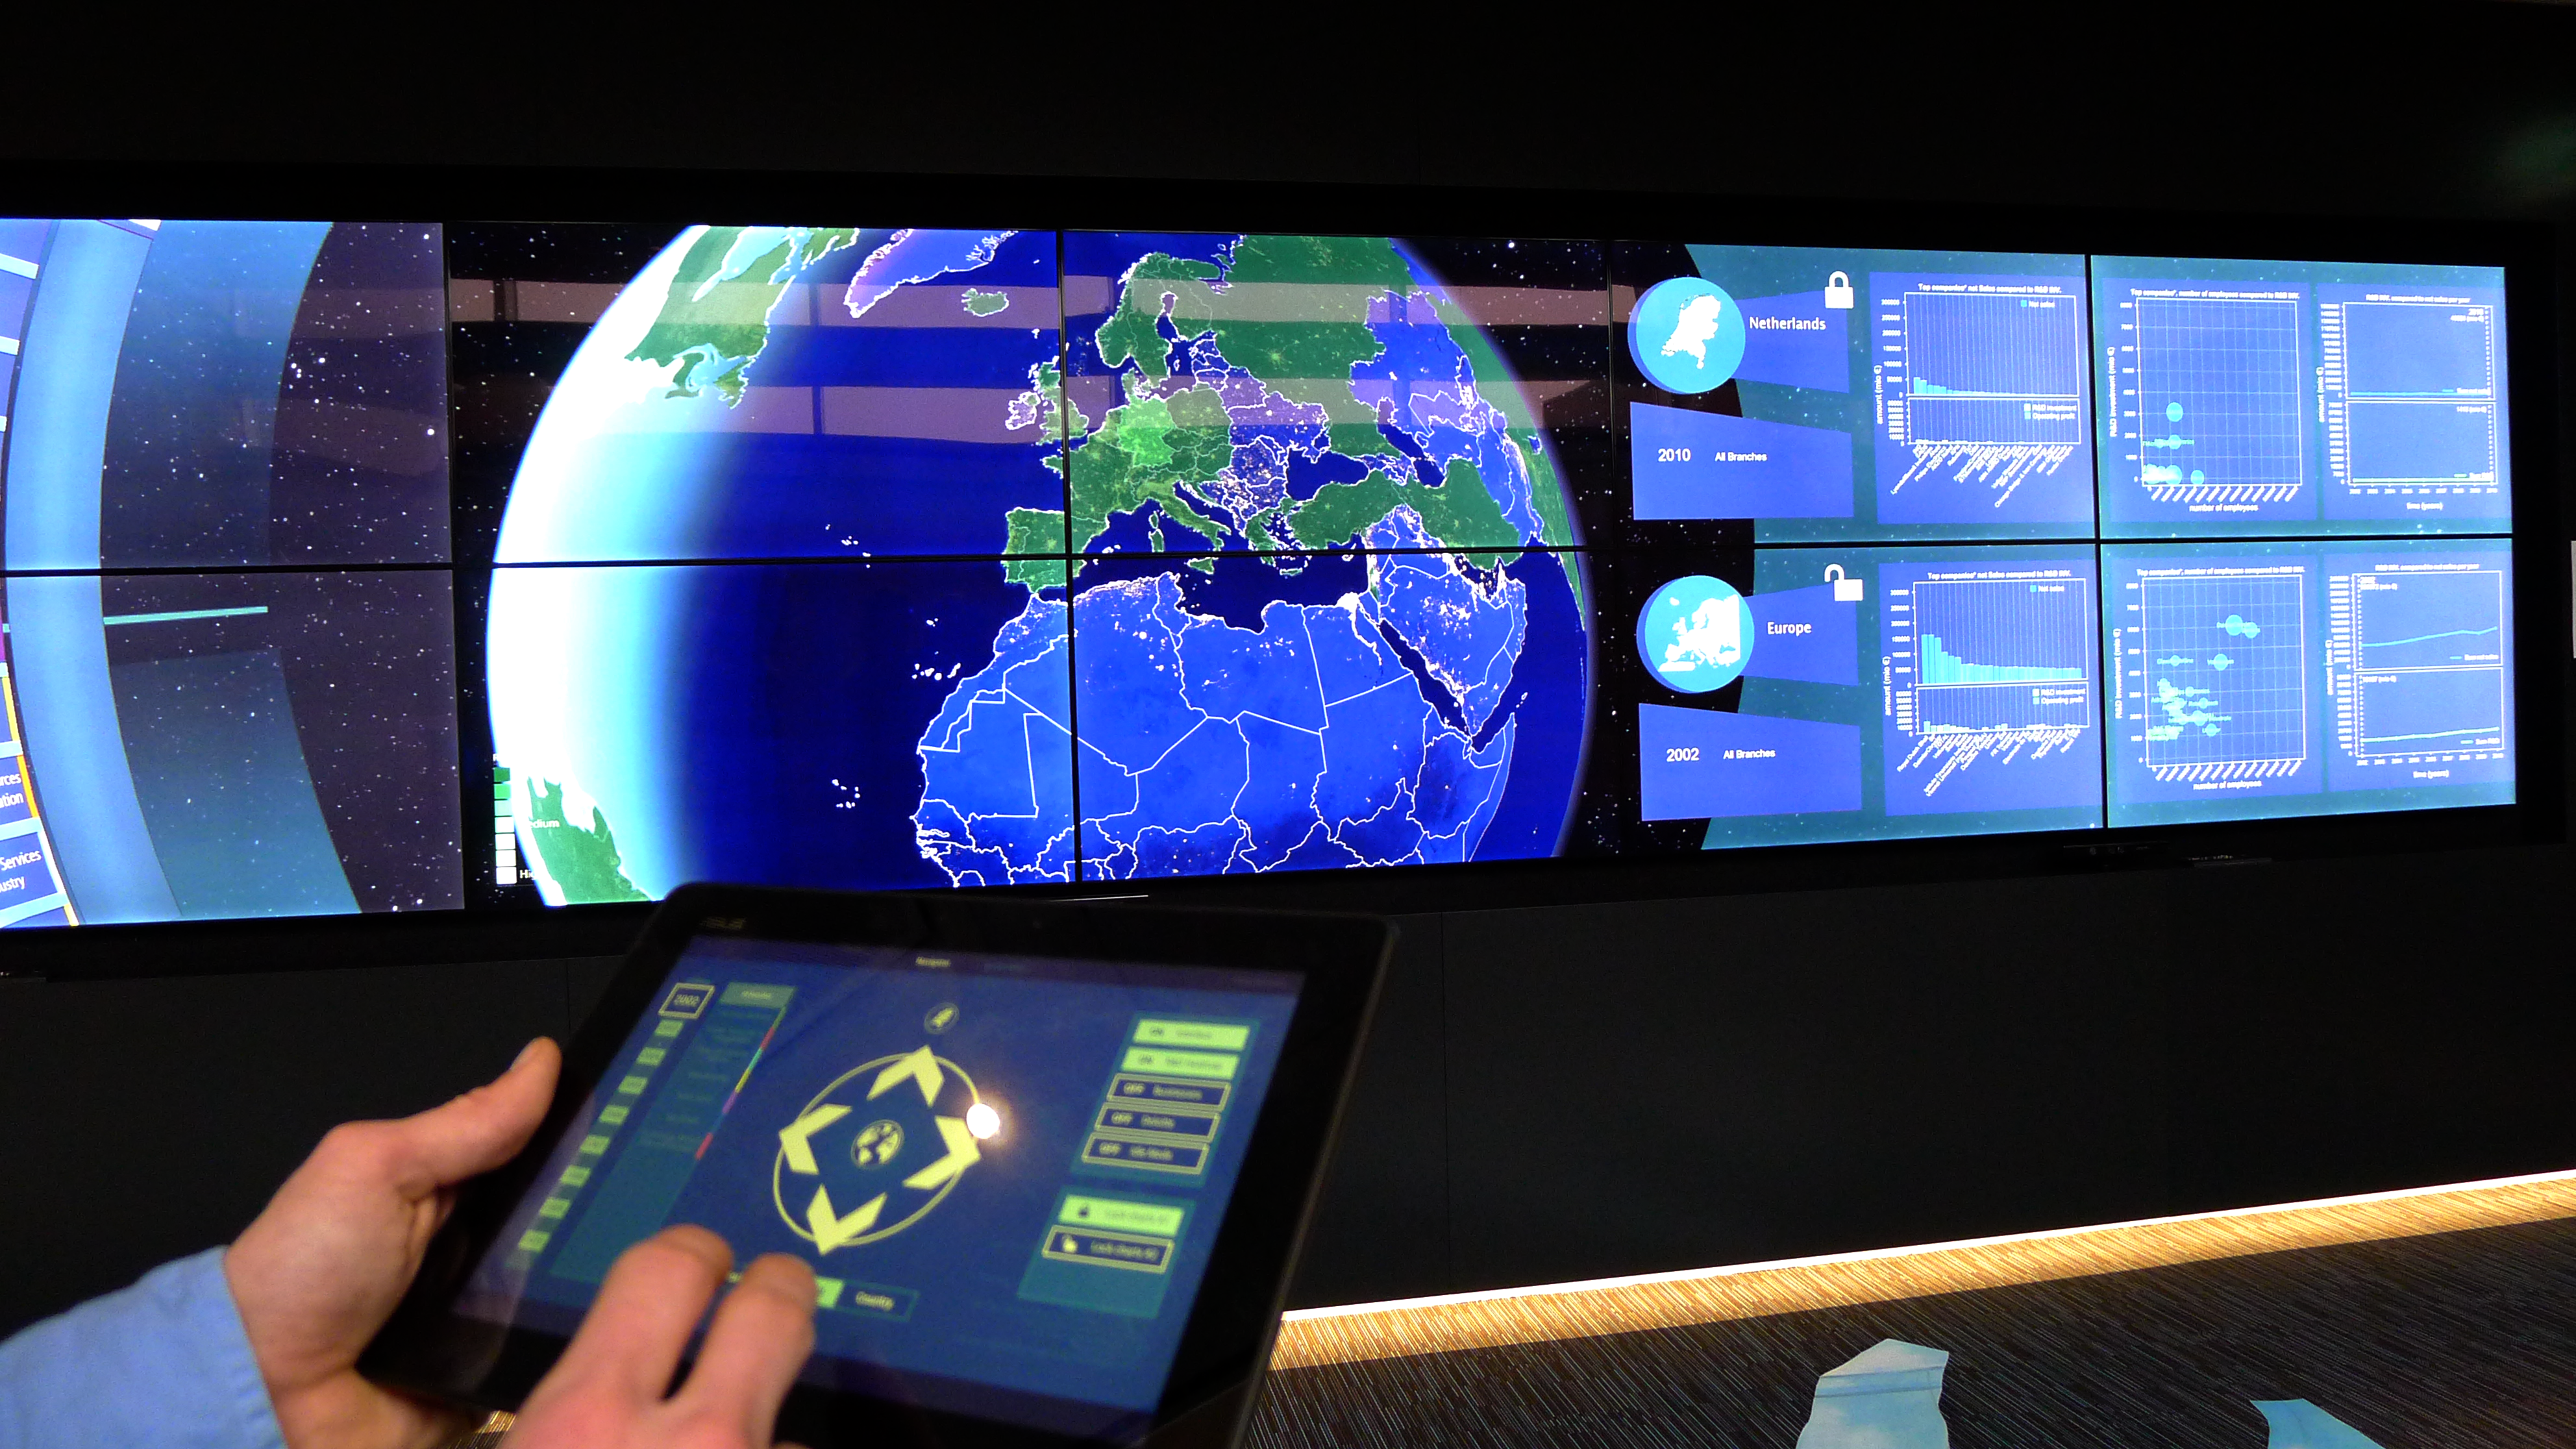
The visualisation consists of a realtime 3D world which you can browse and control with a tablet to explore the different data on R&D investments filtered by year, industry branch, continent or country. By making this available interactively, users can validate and compare different scenarios in new explorative ways.
Technology
We chose the Blender Game Engine (BGE) as the realtime 3D engine to run the actual visualisation, displayed on the iZone’s so called Experience Wall, an 8 meter wide, high resolution screen. It consists of 12 full HD screens and has a total resolution of 5760 × 1080.
The tablet app is a webapp which implements jQuery and ajax to communicate with an http server running in the BGE.
z25 Blender HTTP Server
To establish the connection between the web app and Blender we developed an HTTP server with a REST API that runs in BGE. This server is automatically aware of all the objects in a given scene by means of introspection. This means that with this webservice it is possible to retrieve information on all objects in a scene and manipulate their characteristics remotely.
A standalone version of the Blender HTTP Server can be found on github and includes a working HTTP server with example Blender scene and web client and documentation.
Credits
- Deloitte Innovation Utrecht
- HKU MAPLAB
- Stichting z25.org
